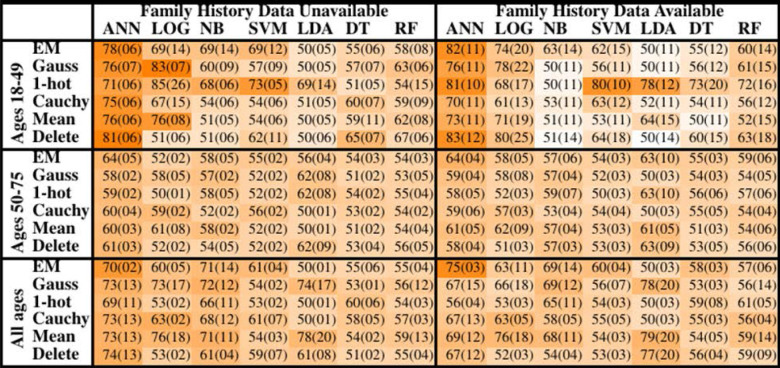
Table 1.
Mean concordance (standard deviation), multiplied by 100, for various machine learning algorithms, imputation methods, age groups, and with or without family history of CRC data.
Models for all ages and ages 50–75 were conducted at TRIPOD level 3 and models for ages 18–49 at TRIPOD level 2b. The standard deviation reported has a component of population-uncertainty from Equation (1) and a cross-uncertainty from Equation (2). The cell shading scheme was determined by subtracting the standard deviation from the mean concordance statistic, so that darker shading indicates a concordance statistic that not only had a higher mean value, but also a lower uncertainty.

