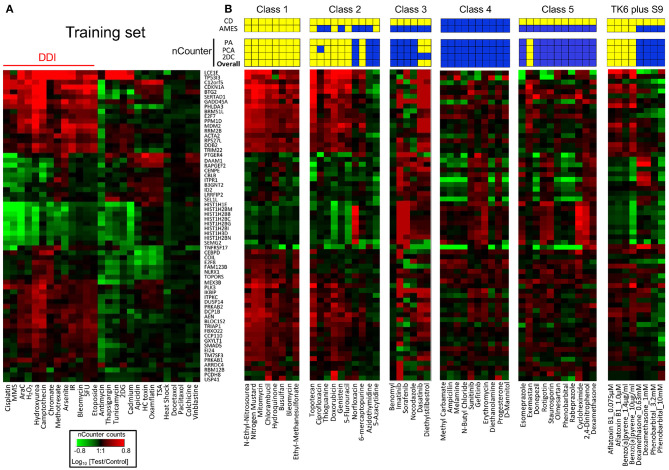
Figure 3.
Performance of TGx-DDI with nCounter® analysis system. (A) Heatmap of Nanostring expression analysis using previously tested chemicals; all chemicals were classified as DDI or non-DDI using the same approach used in the DNA microarray analysis. IR designates ionizing radiation. (B) Thirty-eight chemicals were grouped based on mechanistic properties (Table 1); four chemicals that require metabolic activation were evaluated at different concentrations; heatmaps are shown for nCounter® results for each class and prediction results are displayed above. Three methods were used to predict DDI positive (yellow), and the overall prediction (bottom row) is based on positive results with any of these three methods. Published results with CD and Ames assays are shown in the top 2 rows. Yellow and blue indicate positive and negative findings, respectively.

