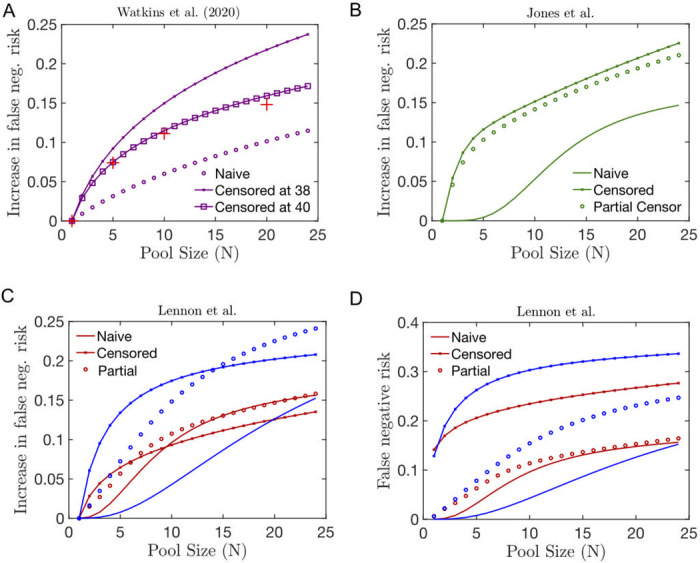
Fig 4.

(A-C) Relative increase in the false negative risk in pools of size N including a single infected individual whose viral distribution is estimated using the naive (solid line), partially censored (circle) or fully censored (crossed line) fitting method of the following datasets from (A) Watkins et al. [54], (B) Jones et al. [56] and (B) Lennon et al. [55]. In (A), we superpose the clinical estimation of the risk of false negative provided in [54] (red crosses). Here, in contrast to [26], we do not change the threshold level of positivity compared to the individual test.
