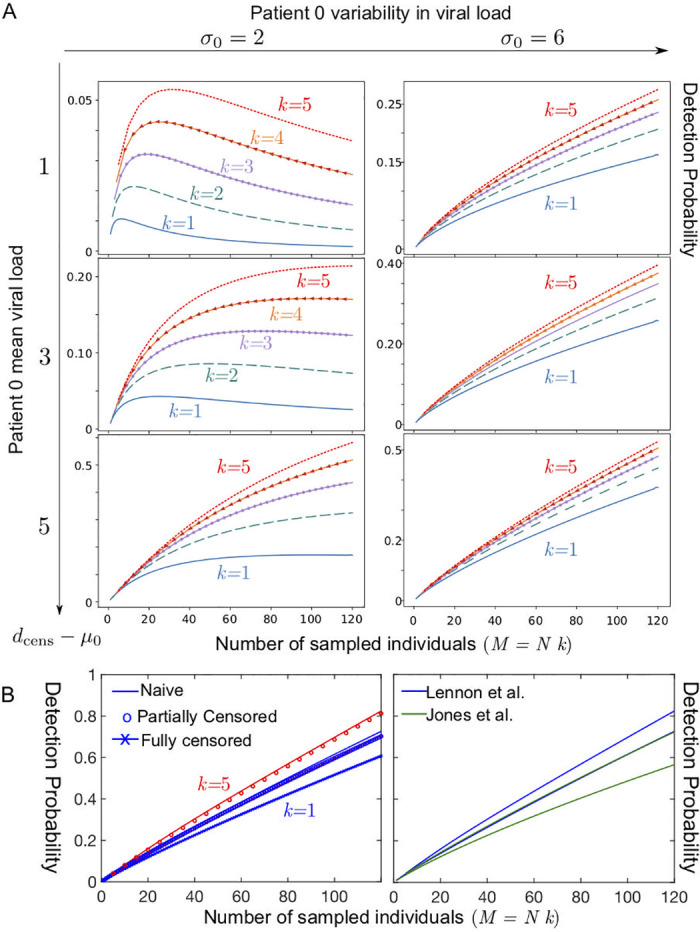
Fig 5.

Detection probability within a community of 120 as a function of the total number of sampled individuals M = k × N, where k is the total number of tests used and N the number of samples pooled together in a test (A) Case of a single patient 0 with low viral load; k = 5 (red dotted line); k = 4 (orange line with arrow), k = 3 (purple line with circles); k = 2 (dashed green line); k = 1 (solid blue line) for several values in the parameters describing the viral load of the patient 0 at the onset of contagiosity, expressed in terms of a normal distribution in Ct (the number of RT-qPCR amplification cycles) with a standard deviation σ0 and a mean μ0 and a threshold at a value denoted dcens satisfying: μ0 = dcens − 1 (top row), modelling a patient 0 with a very low viral concentration, μ0 = dcens − 3 (middle row), μ0 = dcens − 5 (bottom row); σ0 = 2 (left column); σ0 = 6 (right column). (B) Case of a single patient 0 with a viral load distributed datasets(left) for the three fitting methods used to describe the asymptomatic dataset corresponding to Lennon et al. [55], for k = 1 (blue) and k = 5 (red)and (right) comparing the datasets of Lennon et al. [55] and Jones et al. [56] for the naive fitting method (upper curve k = 5, lower curve k = 1).
