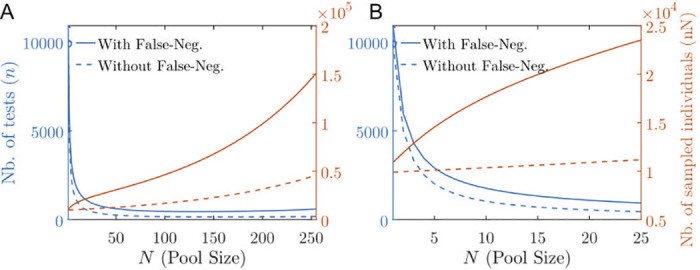
Fig 6.

(A,B) Total number of tests (red) and total number of sampled individuals (blue) in order to estimate a prevalence of p = 1% with a ±0.2% precision with 95% confidence interval as a function of the pool size N for the perfect case (dashed lines) with no false negative versus the case with false negatives (solid lines) estimated according to the Lennon et al. asymptomatic dataset [55]. In (A) N ranges from 0 to 25; in (B) N ranges from 0 to 128. The optimal pool size is beyond the N-axis limit.
