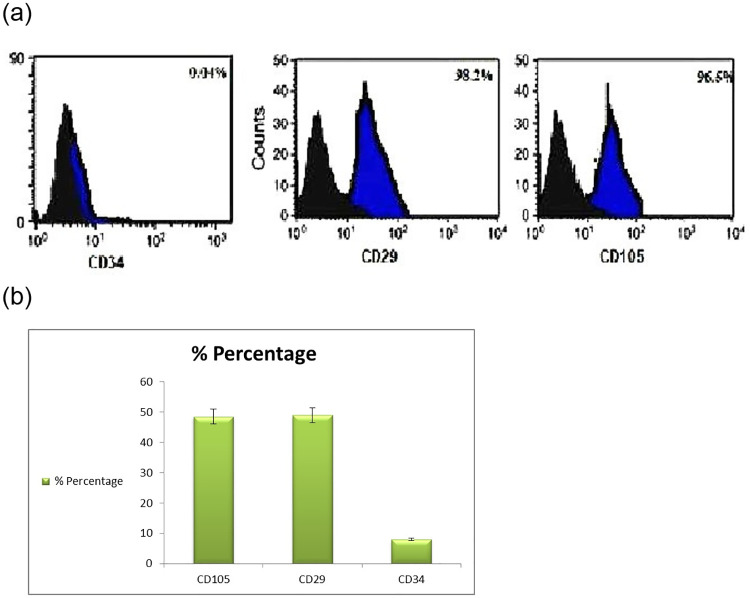
Fig 9. Flow cytometry results of the mesenchymal stem cell markers CD34, CD29, and CD105.
MSCs highly expressed CD29 and CD105 (>95%) and weakly expressed CD34 (<5%). There is a significant difference in CD105, CD 29 and CD 34 expression between bone marrow derived mesenchymal stem cells (P < 0.001). The black area represents IgG (negative control) expression, and the blue areas depict marker expression. The results are representative of three independent experiments. Data are presented as mean ± S.D.

