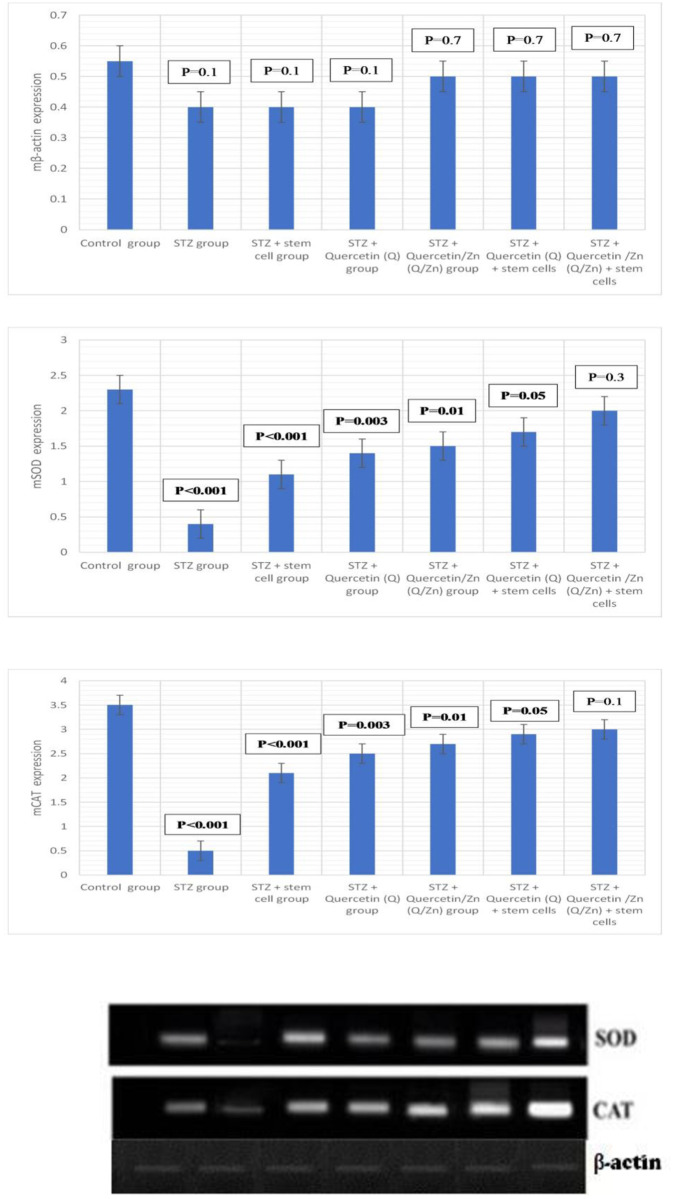
Fig 16. Gene expression of mCAT, mSOD and mβ-actin in lung tissues (mean ±S.E) (n = 8).
Autoradiograms for RT-PCR products corresponding to the different groups in the experiment. Whereas, Represents the expression of SOD, CAT and β-actin. Where, P-value ≤ 0.05 was considered significant. P-value ˂ 0.001 was considered highly significant. P-value ˃ 0.05 was considered non-significant.

