
Fig 1. Challenges in relative and absolute quantification of DNA based on Cq units.
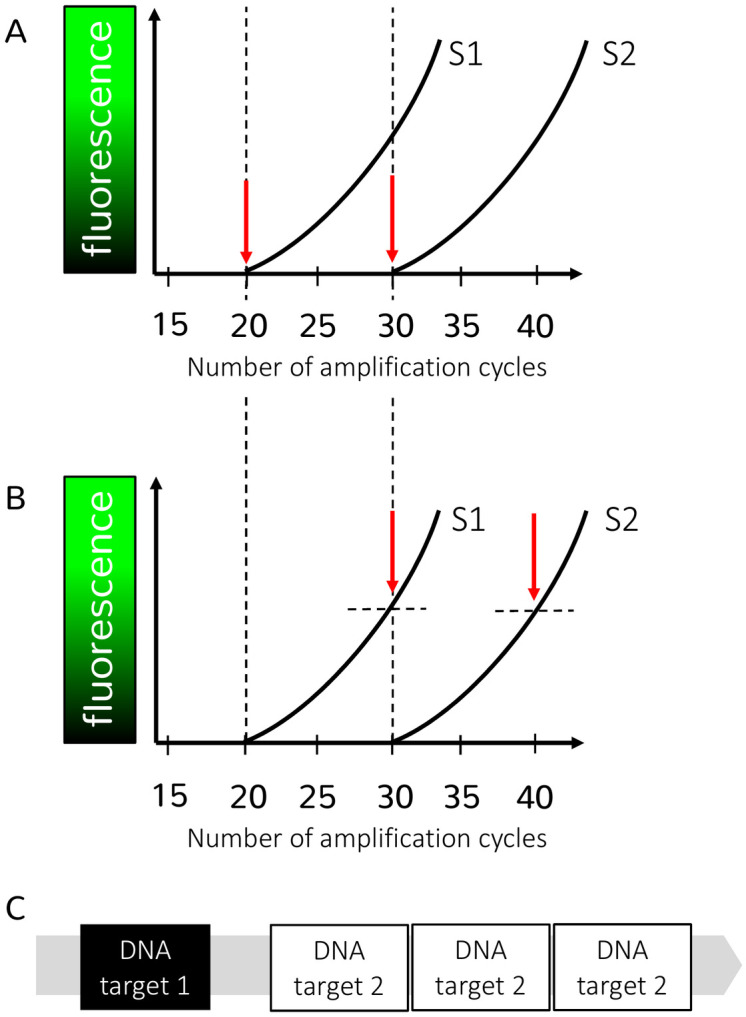
Panels A and B describe the principles of and challenges in relative quantification of DNA, based on Cq units. The x-axis of these panels shows the number of amplification cycles, and the y-axis shows the level of fluorescence detected at each amplification cycle. The sooner a signal is observed, the higher the initial DNA concentration. To illustrate the effect of 2 qPCR platform-specific approaches to determine the Cq value, the same 2 amplification curves of 2 samples (S1 and S2) are depicted in panels A and B. In panel A, the Cq values are defined as the point where the fluorescence signal becomes detectable from the background (y = 0), and the amplification curves have Cq values of 20 and 30 for sample S1 and S2, respectively. This way of determining Cq values is, for example, used by software of the LightCycler480 qPCR platform (Roche). In contrast, in panel B, Cq values are defined as the point where the amplification curve crosses a threshold (dashed horizontal lines), and the same samples as in panel A have a Cq value of 30 (S1) and 40 (S2). This way of determining Cq values is used, for example, in the software of the StepOnePlus qPCR platform (Applied Biosystems). The principle of relative quantification is also shown in panels A and B. In both panels, the difference between the Cq values of the 2 samples is 10 (Cq 30 − Cq 20 in panel A and Cq 40 − Cq 30 in panel B). Therefore, in both panels A and B, S1 contains approximately 1,024 (2difference in Cq = 210 = 1,024) times more DNA than S2. Although in both panels this relative quantification of both samples is the same, the Cq values of the same samples differ substantially across the different platform-specific approaches. Furthermore, the absolute quantity of DNA is unknown, rather, it describes the quantity in samples relatively to each other (relative quantification). Panel C describes the challenges in absolute quantification of DNA based on Cq units. The gray bar represents a simplified genome of an STH species (e.g., Trichuris trichiura). DNA target 1 is a single-copy target, meaning that it is present only once in the whole genome. DNA target 2 is a multi-copy target, meaning that this target is present multiple times in the genome. As an example, laboratory A uses a single-copy gene as a DNA target to detect and quantify T. trichiura and reports a result of 100 genes/mL DNA extract. Laboratory B uses a multi-copy gene as a DNA target and reports a result of 300 genes/mL DNA extract. Because of the unknown quantitative relationship between these 2 genes in the T. trichiura genome, it is also unknown if both laboratories report the same T. trichiura DNA concentration. If both laboratories would express their qPCR results in GE/mL of DNA extract, both would theoretically find the same concentration of 100 GE/mL. Cq, cycle of quantification; GE/mL, genome equivalents per mL; qPCR, quantitative PCR; STH, soil-transmitted helminth.