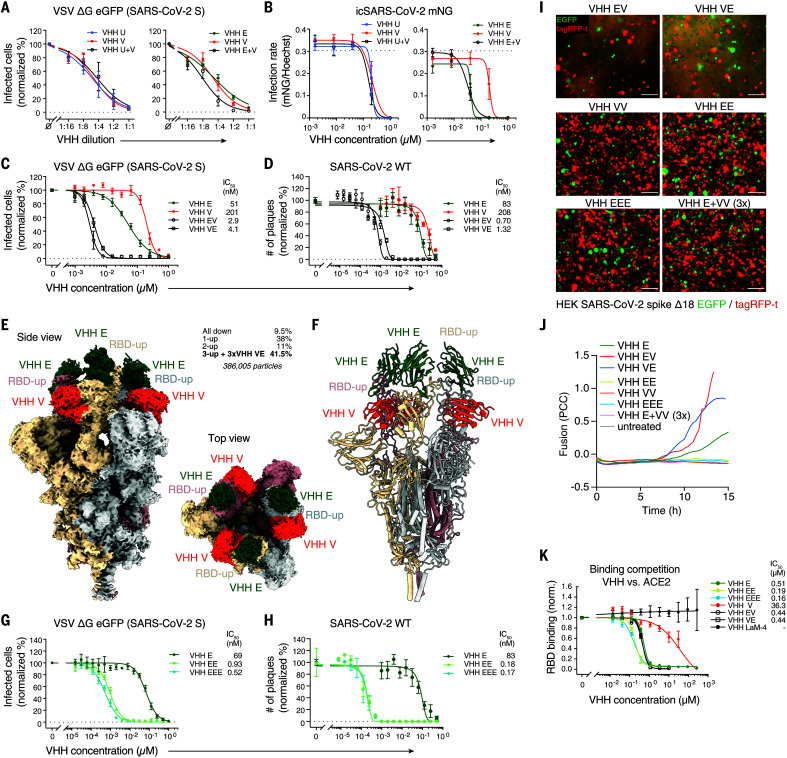
Fig. 4. Multivalent VHH fusions potentiate neutralization of SARS-CoV-2.
(A) SARS-CoV-2 spike–pseudotyped VSV ΔG eGFP was incubated with twofold serial dilutions of 0.25 μM VHH E, 1 μM VHH U, 1 μM VHH V, or the indicated combinations containing 50% of each VHH at 37°C for 1 hour. Vero E6 cells were subsequently incubated with the mixtures, and infection was quantified as in Fig. 1B. Normalized values from three independent experiments ± SEM are plotted. (B) Caco-2 cells were infected with mNeonGreen-expressing infectious-clone-derived SARS-CoV-2 (icSARS-CoV-2-mNG) in the presence of the indicated nanobody concentrations. Cells were fixed 48 hours postinfection and stained for DNA, and infection was quantified by microscopy. Normalized values from three independent experiments ± SEM are plotted. (C and G) SARS-CoV-2 spike–pseudotyped VSV ΔG eGFP was incubated with the indicated concentrations of HA-tagged single, bivalent, or trivalent VHHs at 37°C for 1 hour, followed by infection of Vero E6 cells as in Fig. 1C. Normalized values from three independent experiments ± SEM and IC50 values are plotted. (D and H) SARS-CoV-2 was incubated with the indicated concentrations of HA-tagged VHHs, followed by plaque assay on Vero E6 cells as in Fig. 1D. Normalized values of three independent experiments ± SEM and IC50 values are plotted. (E and F) Cryo-EM reconstruction (E) and atomic models (F) of VHH VE in complex with trimeric SARS-CoV-2 spike. Frequencies of the identified complexes as well as total number of considered particles are noted. The biparatopic VHH binds to SARS-CoV-2 in the 3-up conformation; the resolution is 2.62 Å (0.143 FSC). (I and J) HEK 293 cell lines inducibly expressing SARS-CoV-2 S Δ18 and either eGFP or tagRFP-t were treated with the indicated VHHs and analyzed as in Fig. 3, E and F, displaying representative images after 12 hours (I), as well as quantified fusion (J) (also see fig. S22 and movies S14 to S22). Scale bars, 100 μm. (K) HEK 293T cells expressing ACE2-tagRFP-t were incubated with DyLight 488–labeled SARS-CoV-2 spike RBD in the presence of the indicated concentrations of nanobodies. RBD bound to ACE2-positive cells was quantified by flow cytometry. Normalized data from three independent experiments ± SEM are plotted. Data presented in fig. S2E and Fig. 4K are from the same experiments, and values for VHHs E, V, and LaM-4 in fig. S2E are plotted for reference.

