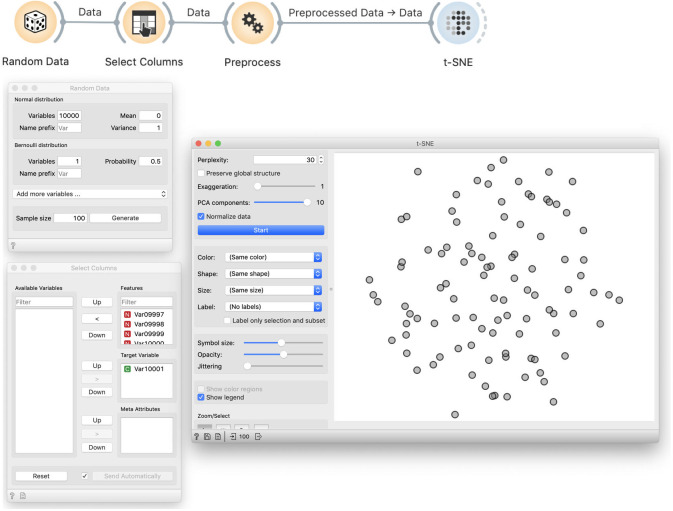
Fig 11. t-SNE visualisation of a random data.
We generate 10,000 normally distributed random variables and one Bernoulli variable, which we designate as the target variable. In Preprocess, we choose ten variables that are most correlated with the target. This data is then used in the t-SNE visualisation. In this particular visualisation, the value of the target variable is not shown, and the dots in the t-SNE visualisation representing the data set items seem to placed randomly, as expected, and do not expose any clustering structure.

