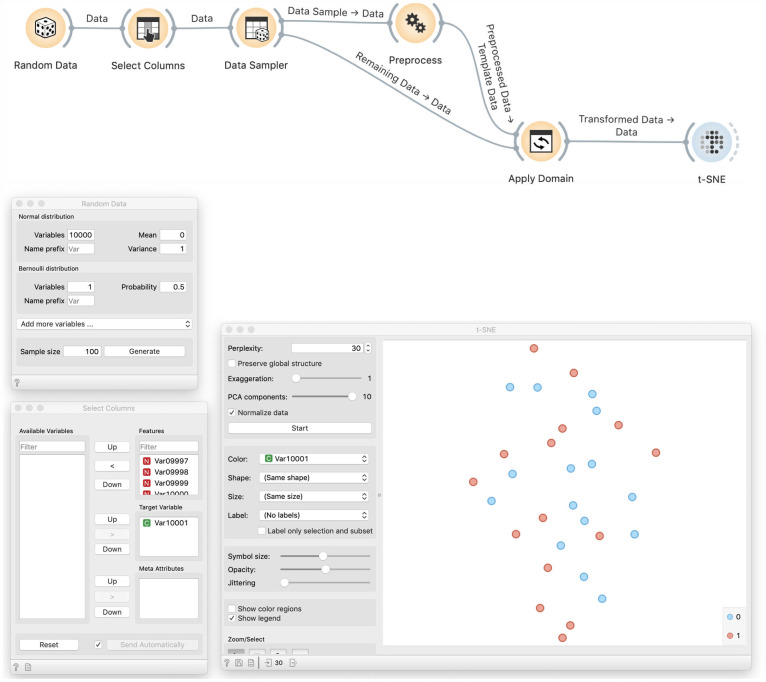
Fig 13. t-SNE visualization of a separate test data.
This workflow uses a random sample to discover the most informative variables, that is, variables that are most correlated with the class variable. The Apply Domain then takes the out-of-sample data and applies the transformation from the Preprocess widget, and in this case, removes all except the ten variables chosen from the sample data. In this way, the procedure that selects the variables is not informed by the data that is shown in the visualization. This time, the data plot does not expose any class structure; red and blue data points are intermixed. Compare this outcome to the overfitted visualization from Fig 12.

