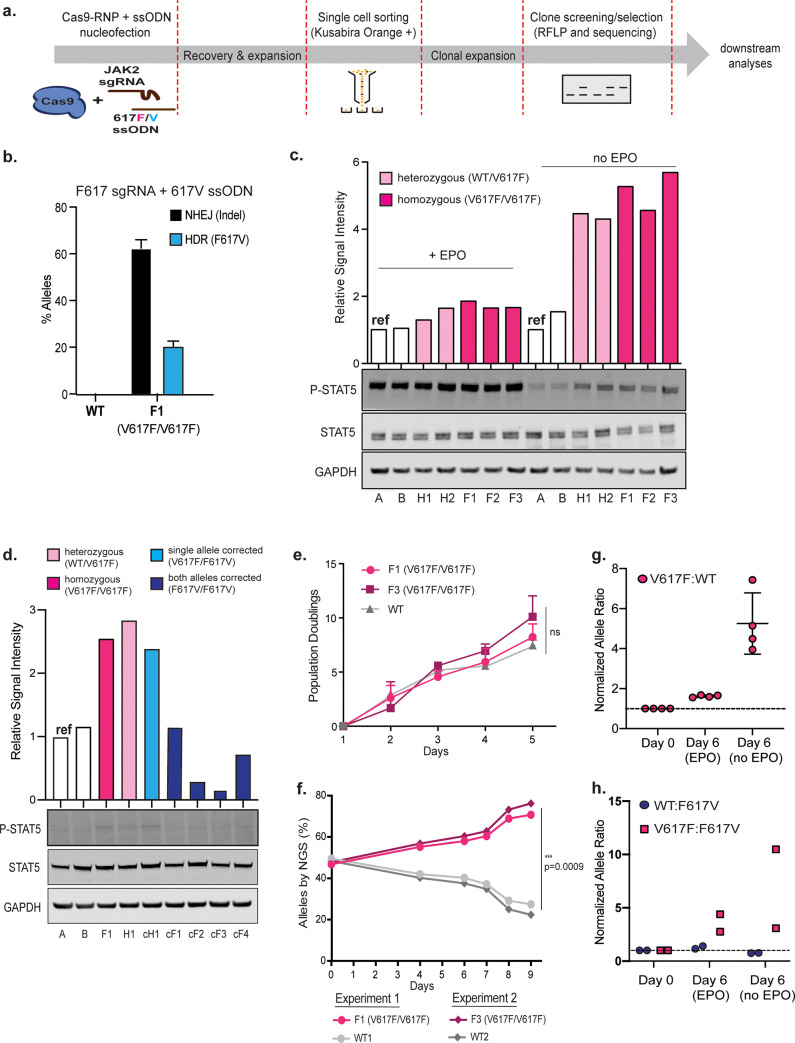
Fig 2. Characterizing the V617F mutation in HUDEP-2s.
(a) Experimental layout for generating clonal allelic series of JAK2 V617F and F617V alleles. Nucleofected HUDEP-2 cells are recovered for 3 days and then sorted at single cell densities into a 96 well plate based on the expression of Kusabira Orange, a marker indicative of HUDEP-2 cell viability. The isolated single cells are expanded for two weeks and subsequently screened for either V617F or F617V alleles by BsaXI restriction digest. Selected clones are validated by TA-cloning and Sanger sequencing. (b) HUDEP-2 WT and V617F cells were nucleofected with Cas9-RNP complexed with F617-sgRNA and the 617V ssODN. NHEJ- and HDR-mediated editing outcomes were assessed by amplicon sequencing and analyzed by Interference of CRISPR Editing (ICE) software. Data from n = 4 independent biological replicates with mean±SD graphed. (c) Representative immunoblot and signal intensity quantification show elevated phosphorylated STAT5 (P-STAT5) expression in homozygous and heterozygous JAK2 V617F HUDEP-2 clones. Signals were normalized to STAT5 and GAPDH. White bars, JAK2 WT clones; light pink bars, JAK2 V617F heterozygous clones; magenta bars, JAK2 V617F homozygous clones. (d) Representative immunoblot and signal intensity quantification show reduced P-STAT5 levels following reversion of the JAK2 V617F mutation back to WT. Signal intensity calculations were normalized to STAT5 and GAPDH. White bars, JAK2 WT clones; light pink bar, JAK2 V617F heterozygous clone; magenta bar, JAK2 V617F homozygous clones; light blue bar, HUDEP clone with single allele corrected (genotype V617F/F617V); dark blue bars, HUDEP clones with both alleles corrected (genotype F617V/F617V) (e) Growth curve depicting cumulative population doublings of HUDEP-2 clones measured for 5 days. F1 and F3 are V617F homozygote clones. Data from n = 5 independent biological replicates. Mean of all experiments ± SD shown. (f) Competitive/co-culture growth assay using HUDEP-2 WT and V617F clones, showing significant outgrowth of V617F clones. Equal proportions of WT and V617F clones were co-cultured in HUDEP-2 expansion media and allelic frequencies were analyzed at 6 time-point spanning 9 days by amplicon-NGS. Circles denote co-culture of F1 and WT1. Diamonds denote co-culture of F3 and WT2. Data is from n = 2 biologically independent replicates. Error bars indicate SD.*: p<0.05 by paired t-test. (g) Co-culture of WT and homozygous V617F clones grown in the presence or absence of EPO for 6 days. Amplicon-NGS time points taken at Day 0 and Day 6. Ratio of V617F:WT alleles detected in culture at day 6 were normalized to day 0 and graphed. Data is from 4 biologically independent experiments each sequenced in technical triplicate. (h) Co-culture of either WT and homozygous F617V corrected clone (circle) or homozygous V617F and corrected F617V clones (square). NGS time points taken at Day 0, and Day 6 with and without EPO. Ratio of WT:F617V or V617F:F617V alleles detected in culture at day 6 were normalized to day 0 and graphed. Data is from 2 biologically independent experiments. Mean±SD graphed.

