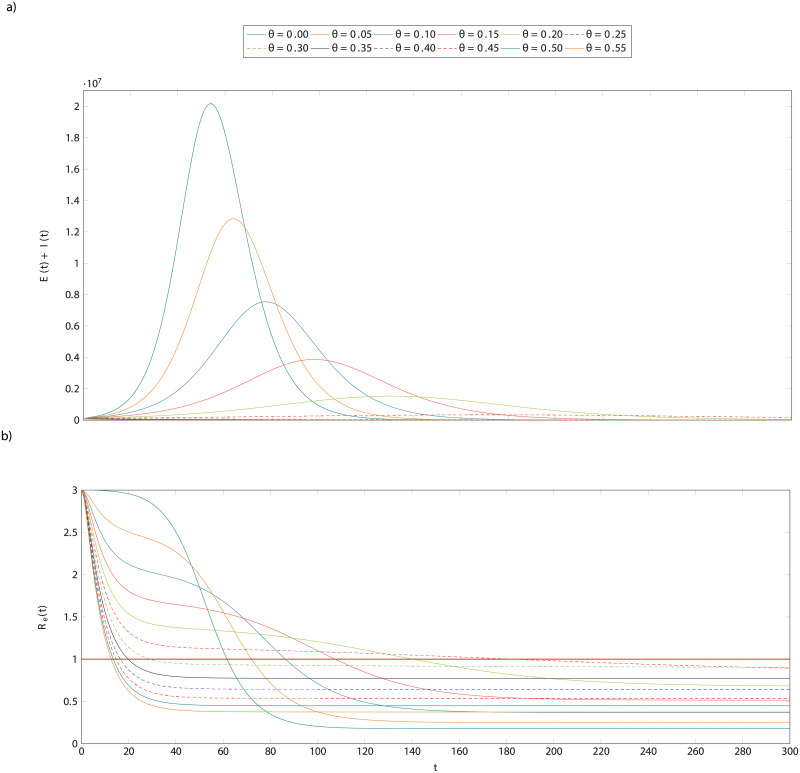
Fig 2. The effect of testing and isolation alone in a hypothetical population.
The dynamics represented here are for a scenario with normal contact, c = 13, and an initial number of infected individuals, I(0) = 100, 000. Individuals who test positive are isolated for the duration of their illness. The top plot shows the total infections (exposed and infectious individuals) over time for various testing rates ranging from none, θ = 0, to testing all infectious individuals every two days, θ = 0.55. The bottom plot shows the reproduction number over time for these same scenarios. Observe that even fairly frequent testing, e.g every five days, θ = 0.2, this is only sufficient to reduce peak infections by one order of magnitude from about 20 million to about two million. In the infrequent testing regimes, θ ∈ [0.05, 0.25], we can also observe that the curve described by Re(t)R(t) is not a sigmoid but instead first falls to a value above R(t) = 1 before stabilising and then falling again. This is because though testing and isolating does have an effect at those rates, it is not sufficiently frequent to identify all of those who are infectious.

