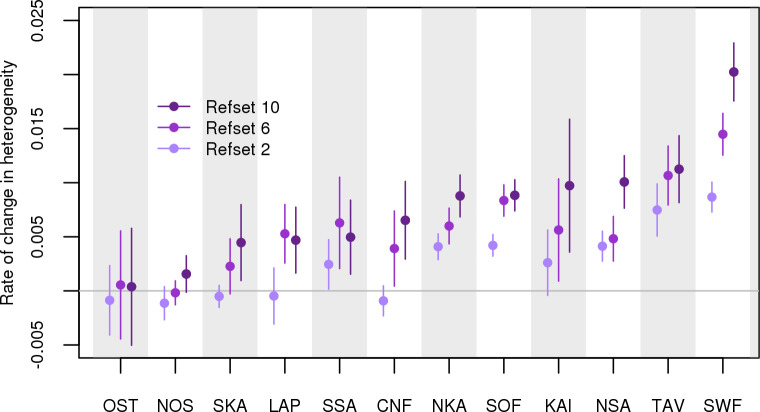
Fig 7. Rate of change in heterogeneity.
The rate of change in heterogeneity at each region of Finland (see Fig 1) between 1923 and 1987. The rate of change is calculated by regressing the entropy of ancestry profiles of the individuals born in the region on their year of birth. Entropy was calculated with respect to refsets 2, 6, and 10.

