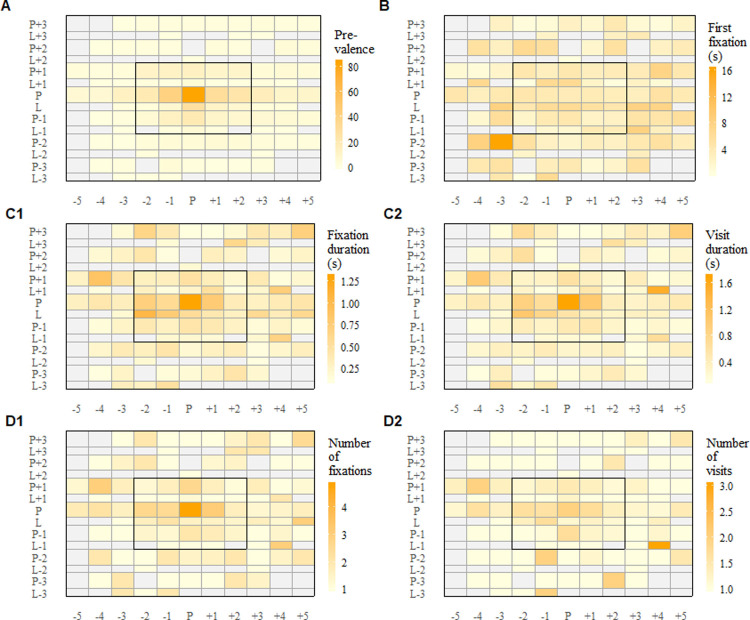
Fig 2. Heat maps for visual attention towards products and shelf labels.
The bought product is placed in the middle of the map and can be identified by the letter P (for product) on the left side and the letter P (for product) below the heat map. The corresponding shelf label can be found directly under the bought product and can be identified by the letter L (label) on the left side and the letter P (product) below the heat map. The product one shelf higher and one row to the left of the bought product can be identified by the coordinates P+1 on the left side and -1 below the heat map. Heat maps show prevalence of attention across all purchases (A), time to first fixation measured in seconds (B), durations for fixations and visits measured in seconds (C) and number of fixations and visits (D). Darker colors in A, C and D indicate longer durations and higher number of fixations and visits. Darker colors in B indicate higher first fixations and delayed awareness. Grey fields mark areas without fixations.

