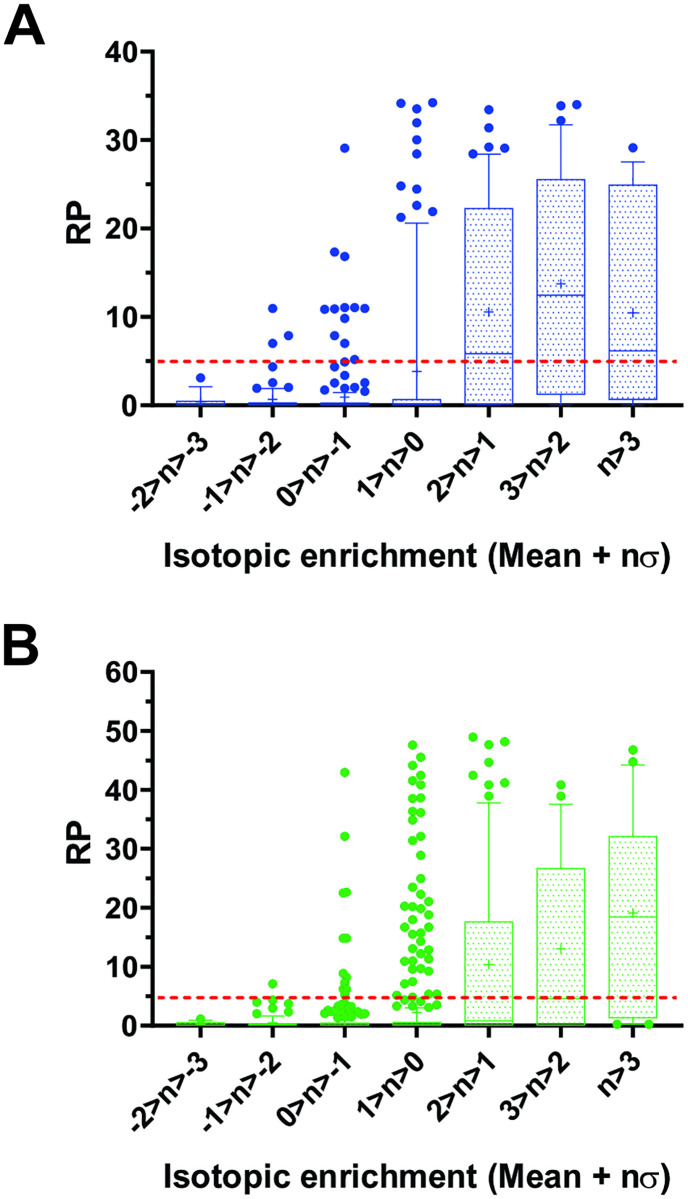
Fig 7. Enrichment in novel N-termini following hydrolysis by MMP-2 or 9 reflects the proportion of protein substrates in respective selectomes.
Following hydrolysis with MMP-2 or 9, the secretome of HEK293 cells was labeled with TMT isobaric tags. Isotopic enrichment (IE) of the novel N-terminally labeled peptides in the MMP-treated samples relative to the untreated controls, was determined by LC/MS analysis of tryptic digests of the labeled secretomes (See text and Methods section for details). The graphs show 10-90th percentile box and whiskers plots of the RP values of the P3-P1՛ sequences corresponding to cleavages in human proteins by MMP-2 (A) and 9 (B) deduced from sequences of N-terminally labeled peptides, as a function of IE expressed as multiples of standard deviation relative to the population mean. The median and mean RP values are marked in the boxes by horizontal lines and crosses, respectively. The red dotted lines mark the selectome thresholds for MMP-2 (RP = 4.5) and MMP-9 (RP = 4.7).

