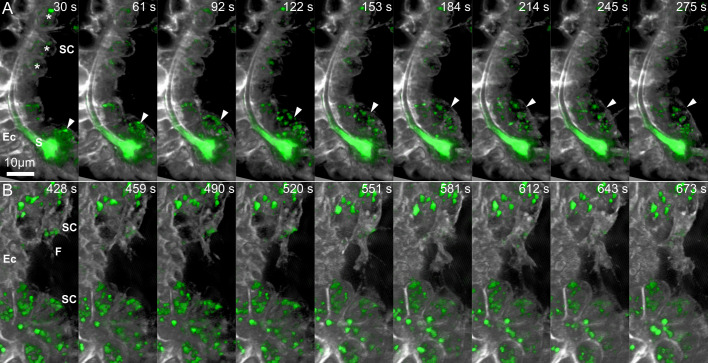
Fig 3. Sequences of time-lapse images demonstrating cellular dynamics in control and under VEGFR inhibition.
(A) Time-lapse images of control embryo (S4 Movie) showing the rapid movement of a free mesenchymal cell (marked in arrowhead) compared to the stable position of the skeletogenic cells that are in direct contact with the ectoderm (asterisks). (B) Time lapse images of an embryo grown under VEGFR inhibition demonstrating the active filopodia extension and fusion between two skeletogenic cell clusters. Relative time from the beginning of the movie is shown in seconds at the top of each frame. Scale bar is 10μm. Ec–ectoderm, S–spicule, SC–skeletogenic cell, F—Filopodia.

