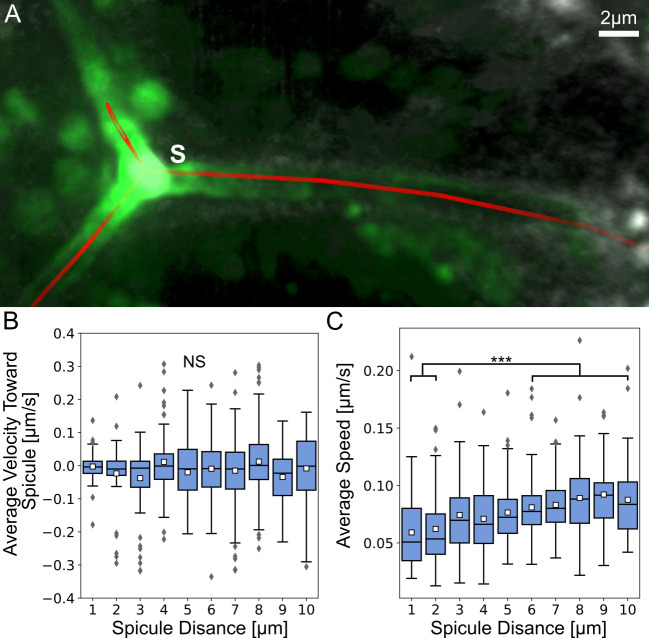
Fig 6. Vesicle velocity is not directed toward the spicule and vesicle speed is lower near the spicule.
(A) An example for the manually identified spicule centerline shown in red with raw image data. (B) Average instantaneous velocity (μm/sec) toward the spicule relative to the average distance from spicule. Each box plot shows the average (white square) median (middle line), the first and the third quartiles (the 25th and 75th percentiles, edges of boxes) and outliers (gray diamonds). (C) Average instantaneous vesicle speed (μm/sec) at increasing average distances from the spicule (μm). The speed at distances 1–2μm are significantly lower than at distances >6μm (Dunn-Sidak test, p<0.001, exact p-values are given in S1 Dataset), with n = 803 vesicles.

