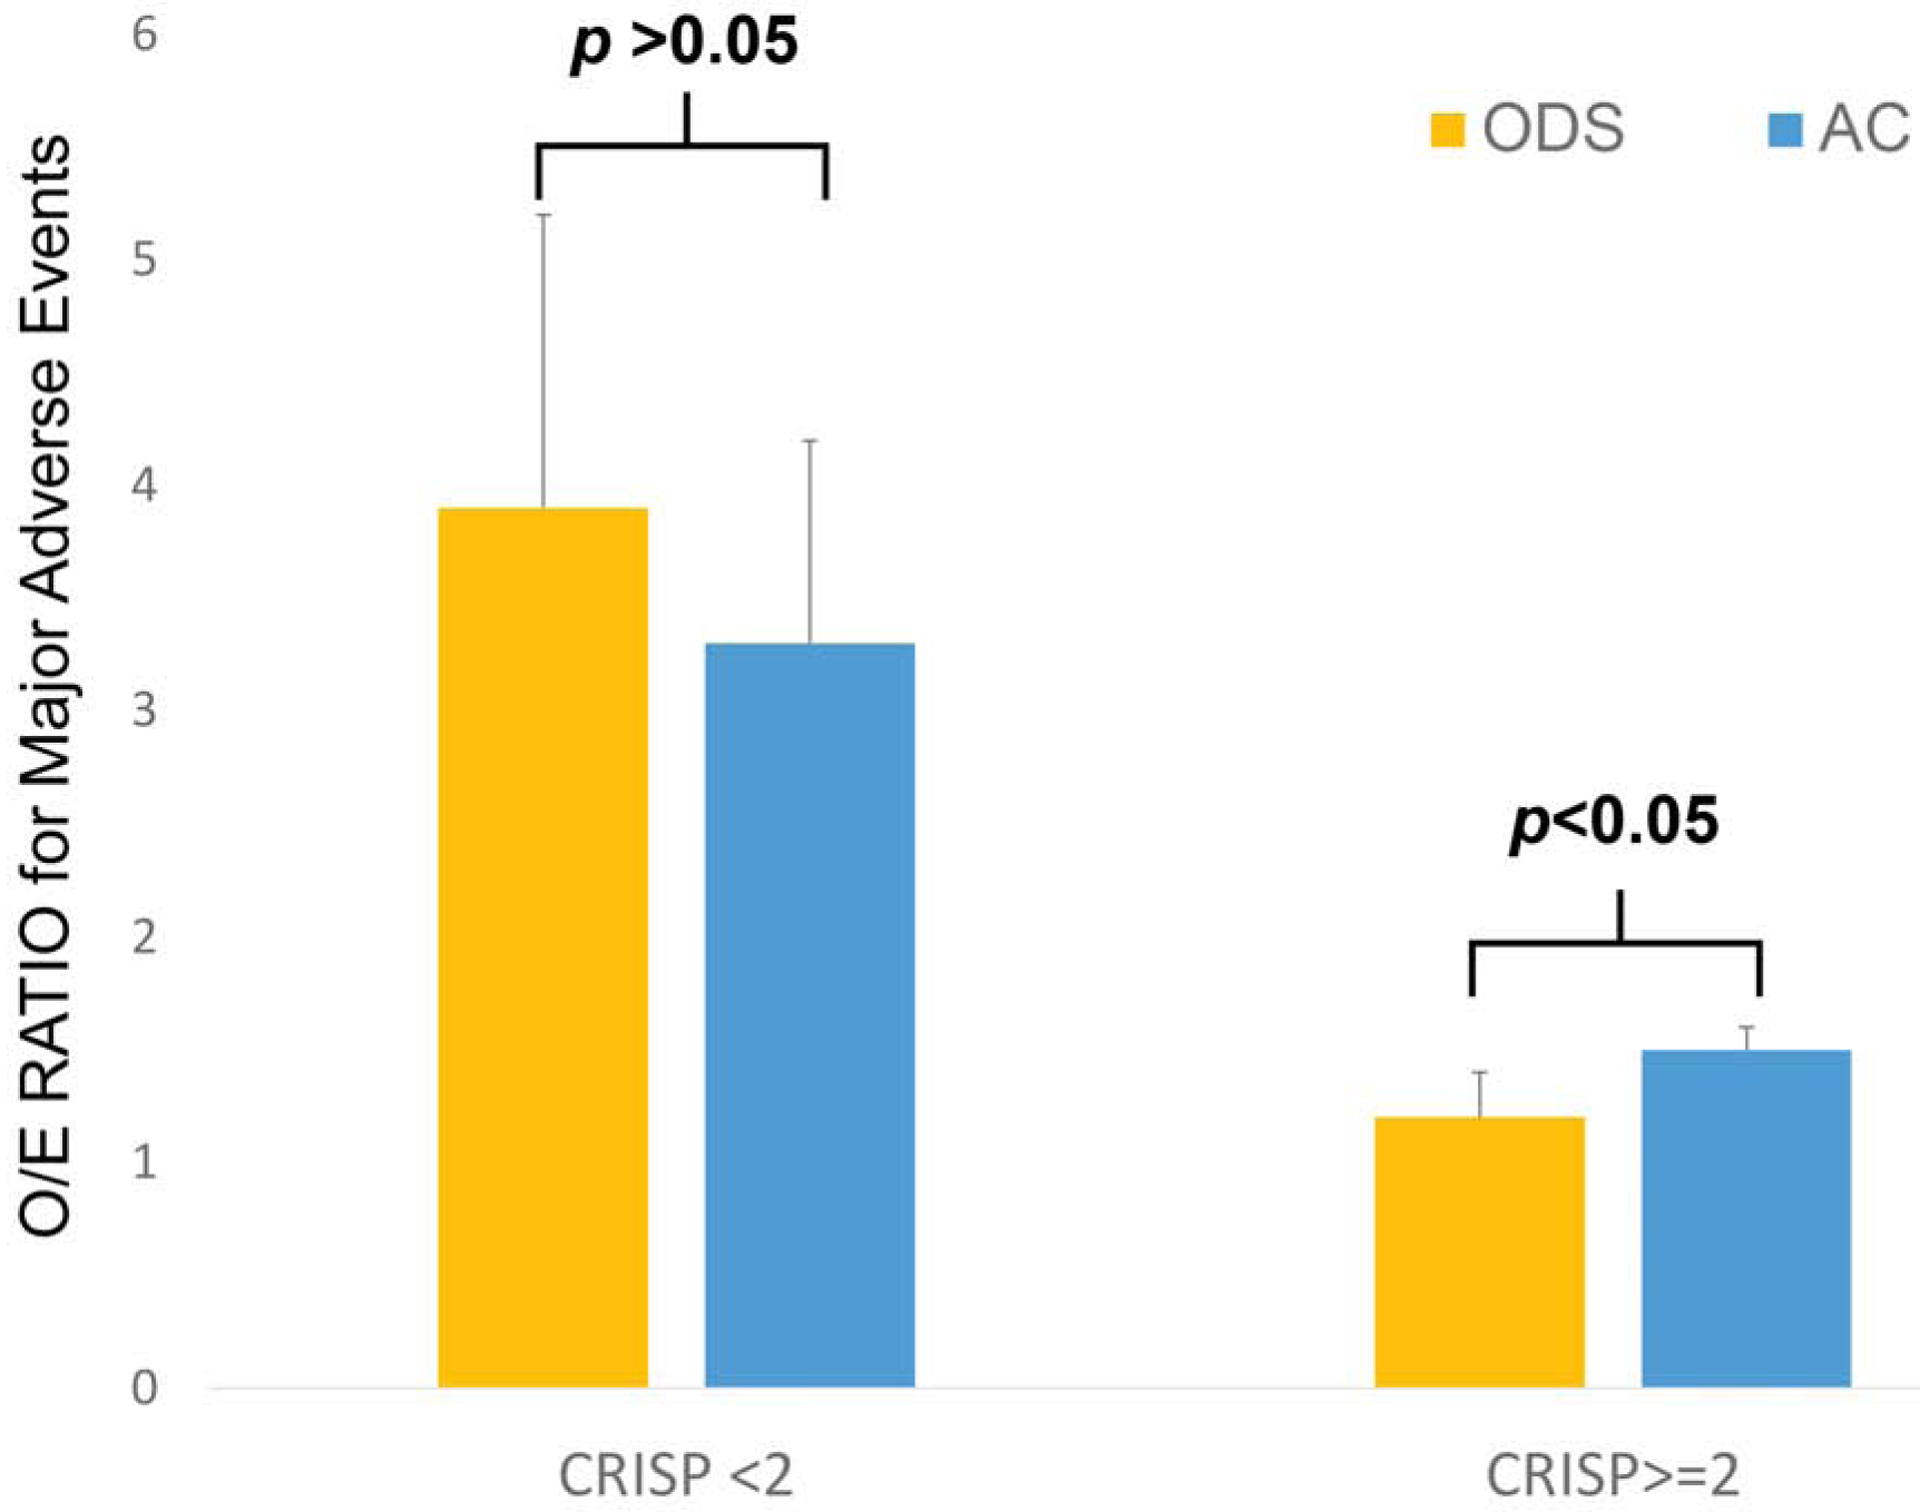
Figure 4: Ratios of observed to expected major adverse events.

Ratio of observed to expected outcomes (O/E ratio) for operator directed sedation (gold) and general anesthesia (blue) cases are depicted along with the top bound of 95% confidence intervals. Cases divided according to categories of CRISP score as per recent CHD-SCAI/SPA/CCAS recommendations.
