. 2021 Feb 3;10:e65878. doi: 10.7554/eLife.65878

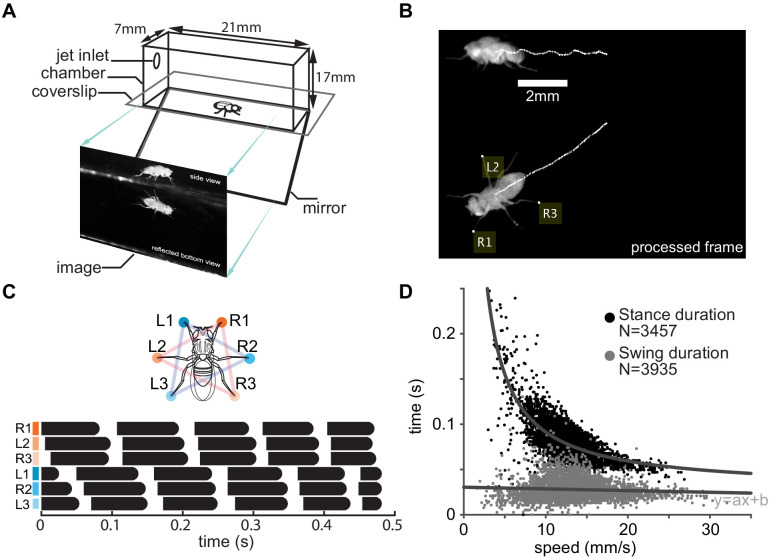
Figure 2. Experimental setup.

(A) Schematic of the arena. (B) A frame from a typical processed video of a fly walking in the chamber. The white traces track a point on the thorax and are a proxy for the center of mass. Yellow labels denote feet that are in stance, or the footholds. (C) Leg numbering and color coding (top), and gait maps (bottom) showing footfall patterns of individual legs in the R1–L2–R3 (orange) and L1–R2–L3 tripods (blue). Each row corresponds to a single leg. Black bars represent stance. (D) Stance and swing durations as functions of speed. The top dark gray line is the best fit of the reciprocal function to stance durations. The bottom lighter gray line is a best fit of linear regression to swing durations and shows a small decrease (a: −0.00018, p<0.00001, b = 0.03).

Figure 2.

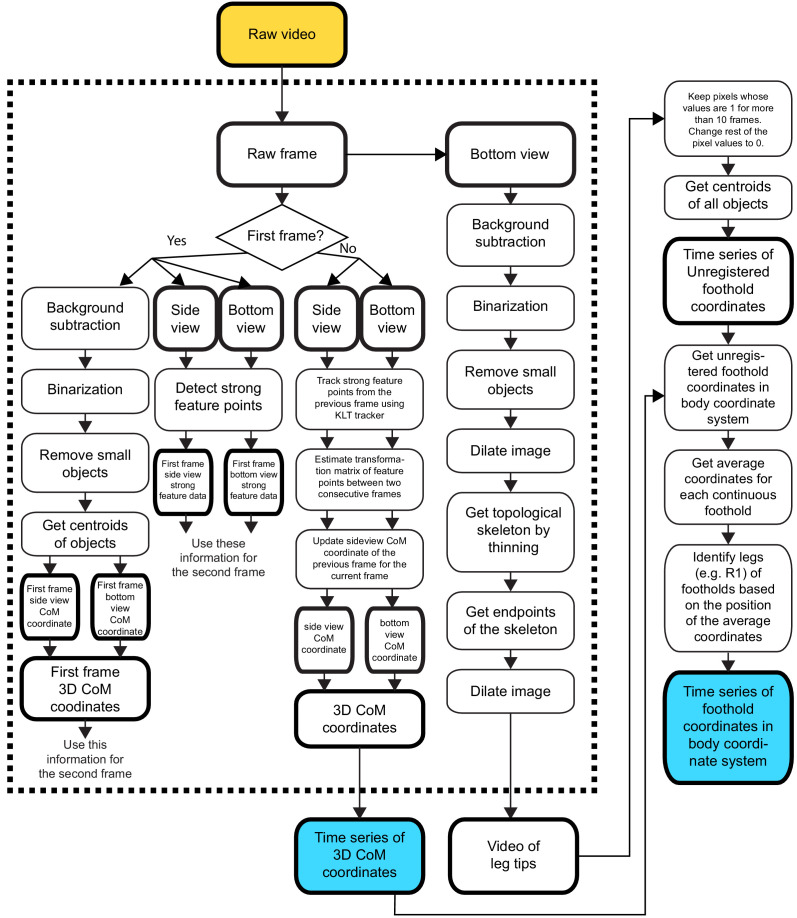
Figure 2—figure supplement 1. Image processing used to obtain the 3D coordinates of the center of mass (CoM) and the time series of footholds in the body coordinate system (referred to from 'Materials and methods').

Figure 2—figure supplement 1.

Yellow box denotes input, and blue boxes denote output. Rectangular elements with thick edges denote processed output. Rectangular elements with thin edges denote processes.
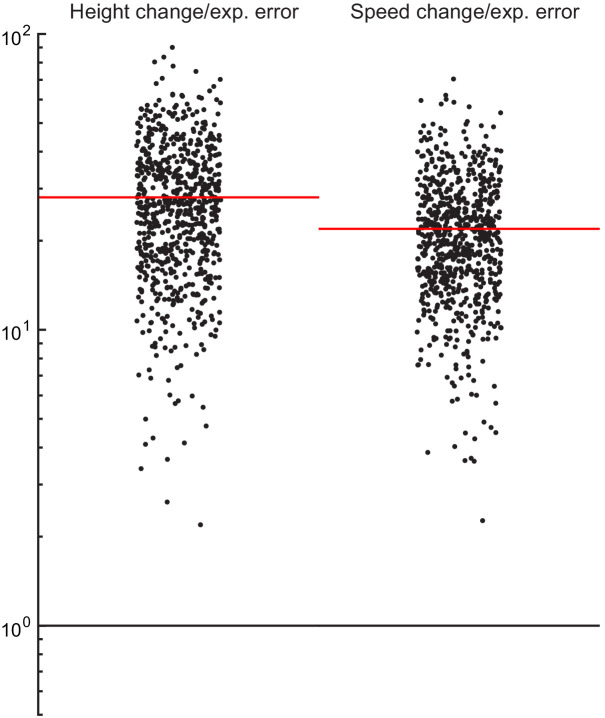
Figure 2—figure supplement 2. Size of experimental tracking error compared to height change and speed change values (referred to from 'Materials and methods').

Figure 2—figure supplement 2.

Height change and speed change values were divided by root mean squared error of tracking. Height change and speed change values are similar but different to the metric defined in 'Materials and methods', 'Definition of M-tripod'. Here, after detrending a trajectory, we are subtracting minimum from maximum instead of summing. This quantity indicates the overall amplitude of fluctuation. Red lines are means of the ratios.