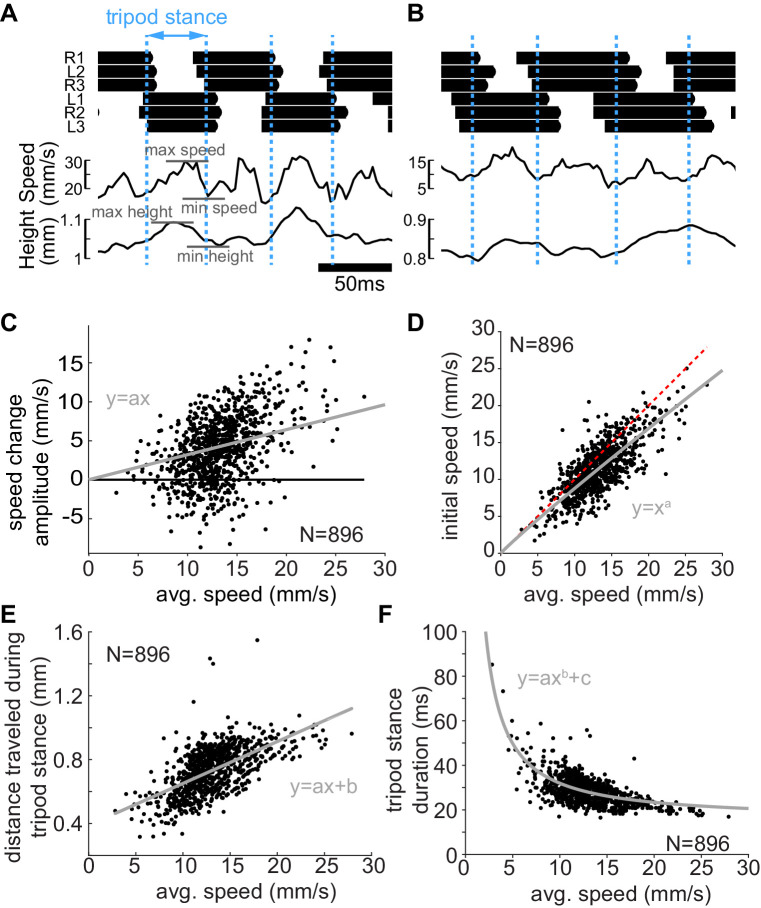
Figure 4. Mechanical changes associated with changes in speed.
(A) Example trace showing the changes in center of mass (CoM) speed and height. Dotted blue lines are the boundaries between consecutive tripod stance (see text). The CoM shows clear mid-stance maxima in height and speed. (B) A slower step is characterized by smaller initial speed, smaller speed changes, and lower height. (C) Within step speed changes increase with speed (p<0.0001). Line is the best fit of y=ax to the data. a = 0.32. (D) The initial speed increases as the fly walks faster, but this increased speed makes a smaller contribution at higher speed reflected by the increased deviation (gray line is the best fit) from the line of unity (dotted red line). a = 0.9438; 95% confidence bounds (0.9393, 0.9484). (E) Distance traveled during tripod stance increases with speed (p<0.0001). a = 0.026, b = 0.39. (F) Tripod stance duration decreases with speed. a = 187.8, b = −1.056, c = 15.45.


