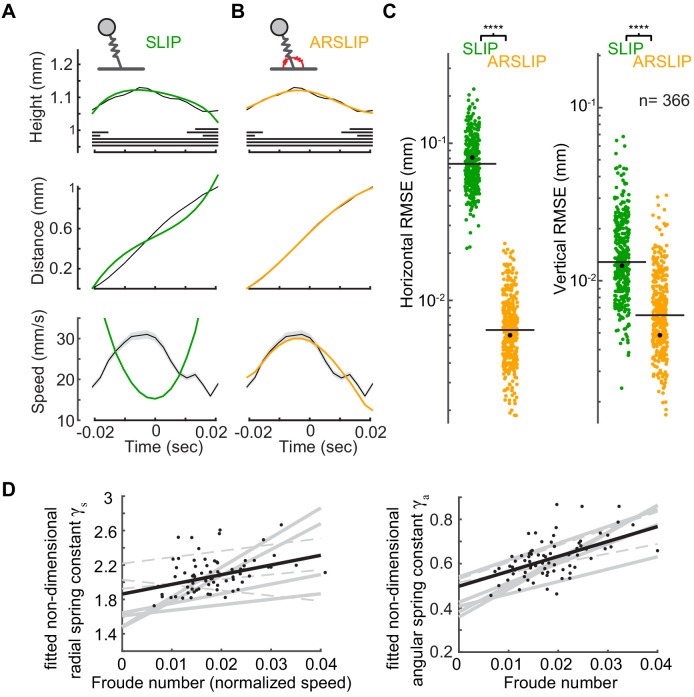
Figure 6. Angular and radial spring-loaded inverted pendulum (ARSLIP) describes the kinematics of a fly’s center of mass (CoM).
(A) The best fit of SLIP (green) and (B) ARSLIP models – to the height (top) and horizontal position of the CoM (middle). Speed (bottom) was not used to fit but is plotted to simply show why SLIP fails. Gait maps are shown with CoM height. (C) ARSLIP is a significantly better model than SLIP (Wilcoxon rank-sum test; p<0.001 for both horizontal and vertical movement). Each dot is the root mean squared error (RMSE) for the best fit to a single tripod stance. The example step presented in (A) and (B) is marked as a black dot and was chosen close to the SLIP median RMSE. Black horizontal line is the median. (D) γs (left) and γa (right), which are nondimensionalized spring constants, increase with speed in most flies. Each line is a fit to the steps from a single fly. Black dots (n = 74) show values corresponding to individual steps for one fly and the fit corresponding to that fly. Solid lines are the regressions with p<0.05 from F-test, and dotted lines are p>0.05.


