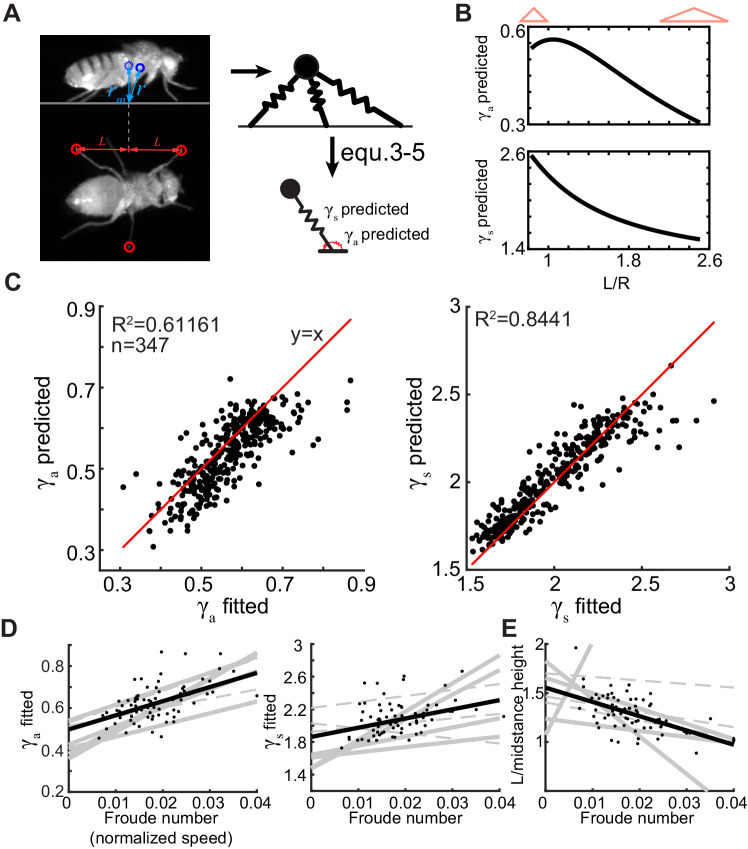
Figure 7. Flies increase their height and decrease the extent of their tripod as they increase their speed.
(A) We measure rm and L for each step which describe the tripod geometry during a step. The tripod geometry can be used to predict γa and γs using Equations 3–5. (B) γa (top) and γs (bottom) decrease as L/rm increases. Narrow and high tripods are stiffer (see red cartoons atop). (C) The spring constants predicted from geometry closely correlate to the optimal spring constants calculated in Figure 6 (γa: left and γs: right). The red line is the line of unity. (D) γa (left) and γs (right) replotted from Figure 6 show increase with speed. (E) Increases in Fr in most flies are concomitant with decrease in L/rm. Each line is a fit to a different fly. Solid lines are the regressions with p<0.05 from F-test, and dotted lines are p>0.05. Black dots (n = 74) show values corresponding to individual steps for one fly, and black line is a fit for that fly.

