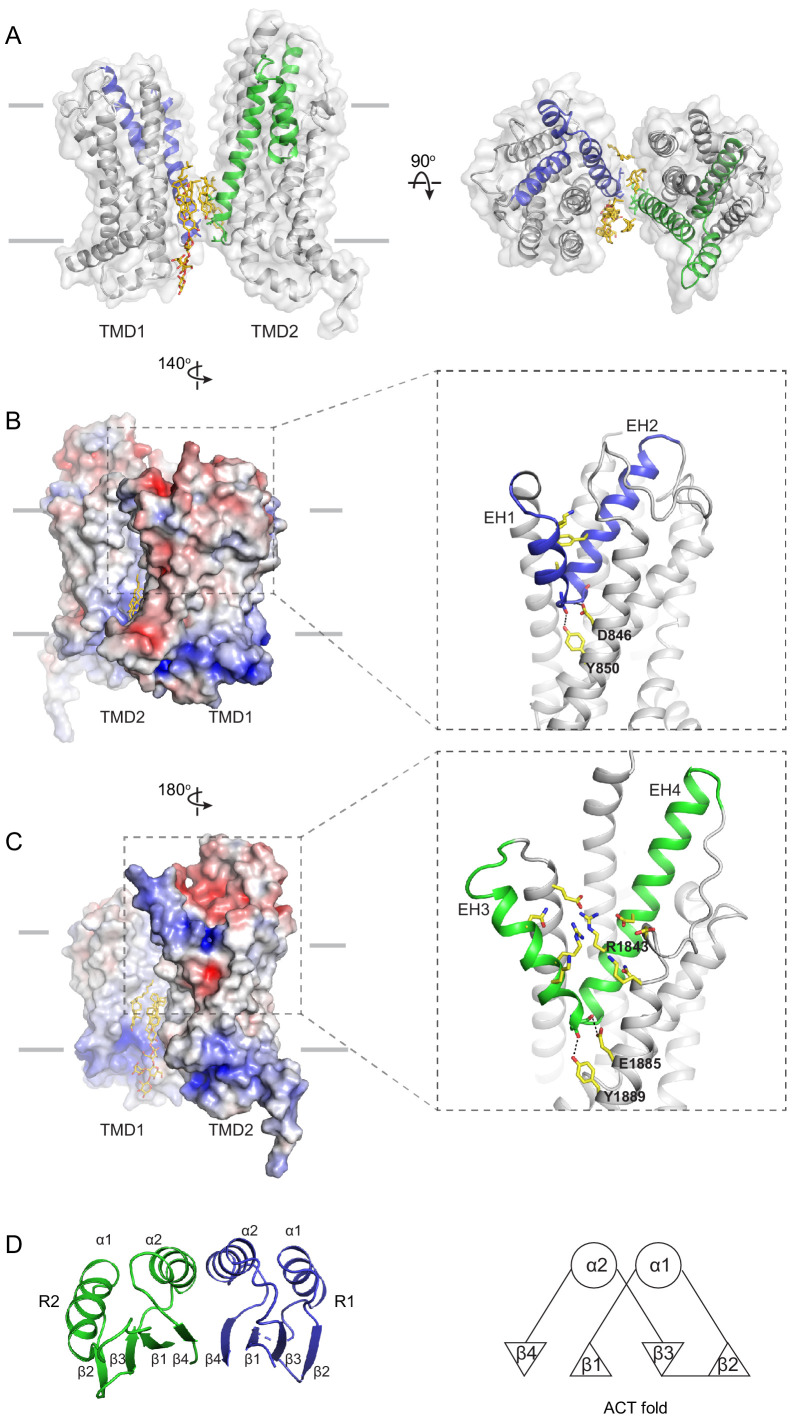
Figure 4. The structures of the transmembrane domains (TMDs) and regulatory domains (RDs).
(A) Two views of the TMDs. EH1, EH2, and TM5 are highlighted in blue, and EH3, EH4, and TM11 are in green. The side chain of residues making inter-subunit contacts is shown as stick model. Lipids are shown in yellow. (B) Electrostatic surface representation of the TMDs, calculated assuming a pH of 7 and a concentration of 0.15 M of both (+1) and (−1) ions. Scale: red, negative (−5 kT/e); blue, positive (+5 kT/e). The EH1-turn-EH2 insertion is highlighted as blue ribbon. (C) An orthogonal view of (B), highlighting the hydrophilic indentation formed by the EH3-turn-EH4 insertion. (D) The RDs exhibit the ACT-like fold with the βαββαβ topology. EH: exocytoplasmic helices.


