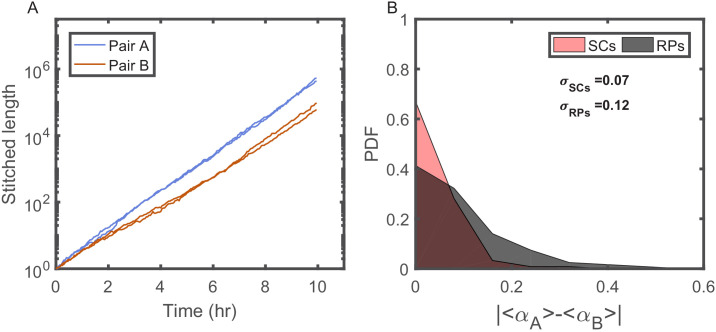
Figure 2. Individuality of cellular growth dynamics in different microenvironments.
(A) Depicts the cell length of two pairs of SCs measured in two different V-shaped traps as a function of time. The length of each cell is presented in a ‘stitched’ form, where the length of the cell in each cell cycle is adjusted to start from the length of the cell at the end of the previous cycle, ignoring by this the division events. This is done by dividing the length in each cycle by the starting length and multiplying it by the length of the cell at the end of the previous cycle. This presentation emphasizes the difference in the average growth rates measured in different traps. Note, however, that each pair of SCs exhibits similar average growth rate. (B) Probability distribution function (PDF) of the absolute difference in the average growth rate of two SCs is compared with the absolute difference in the average growth rate of two randomly paired cells (RPs) growing in separate traps in the same device (see Figure 4A for further elaboration on random pairing of cells). The standard deviation of the difference for SCs () is almost half of the calculated value for RPs (). This shows that cells grow with different average growth rates in different traps and supports the idea of micro-niche formation in the microfluidic device.

