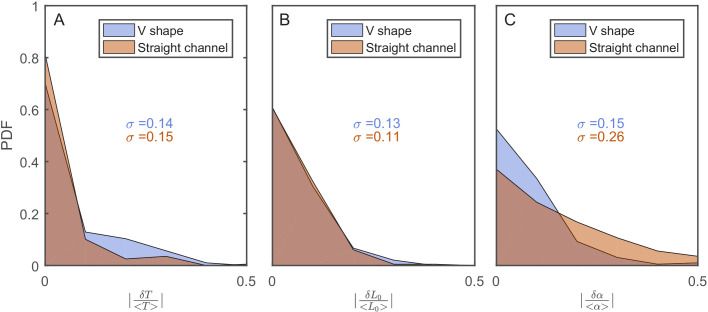
Figure 3. The effect of the v-shaped channel on the distribution of the different cellular characteristics between SCs during division.
(A) Probability distribution Function (PDF) of the difference in the first cell-cycle time of two sister cells after separation relative to the population’s average cycle time under the same experimental conditions. (B) PDF of the difference in cell length between the sister cells immediately after division relative to the population’s average length at the start of the cell cycle. (C) PDF of the difference in the growth rate of the two sister cells after separation relative to the population’s average growth rate. The difference measured in the straight channels here is larger than that measured in the v-shaped channels. This could be due to the fact that the two cells in the mother machine trap are at different distance from the nutrients diffusing from the flow channel into the traps. This has been shown before to result in variation in the cells growth rate (Yang et al., 2018). In all graphs, the blue curves represent the distributions measured in our new device with the v-shaped channels using 194 pairs, while the brown curves were measured in the straight channels of the mother machine using 198 pairs.

