. 2021 Feb 1;10:e64779. doi: 10.7554/eLife.64779

Figure 5. Variance (σδα2) as a function of the time.

(A) σ2 of the growth rate difference (δα) between cell pairs for NCs and RPs as a function of time (see Figure 5—figure supplement 3 for the details of the calculation). The variance for both pair types does not change over time. (B) δα of SCs, on the other hand, exhibits large variance immediately after separation (∼50%) higher than NCs and RPs and rapidly drops to its minimum value within one generation time (∼30 min), and increases thereafter for 4 hr (∼8 generations) until saturating at a fixed value equivalent to that observed for NCs and RPs. Each point in A and B is the average over three frames moving window, and the shaded area represents the standard deviation of that average. (C) Unlike δα, δf of SCs increases to its saturation value within ∼2 generations (see Figure 5—figure supplement 4 for the details of the calculation). Here, each point represents the average of three different experiments, and the shaded part represents the standard deviation.

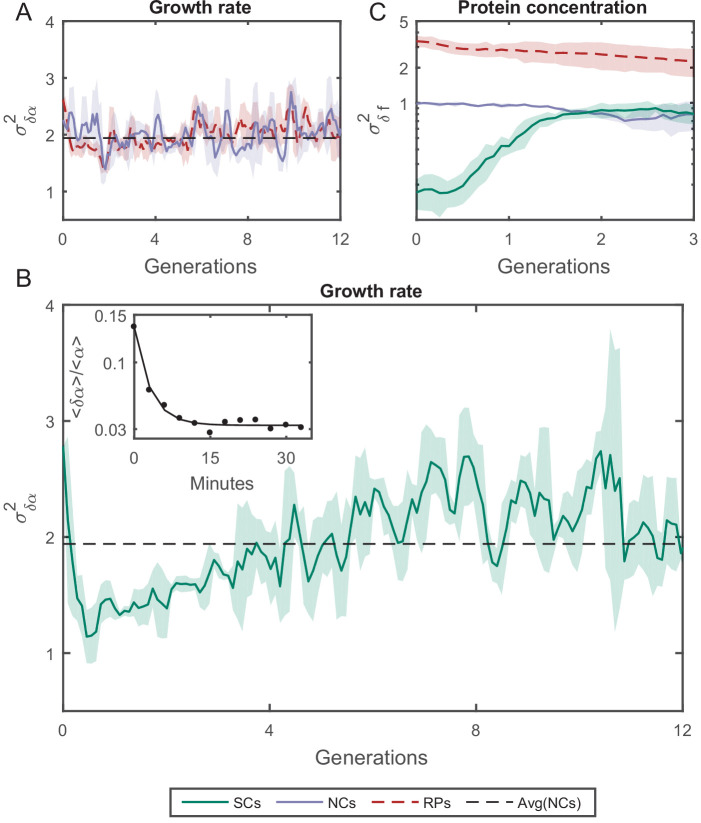
Figure 5.

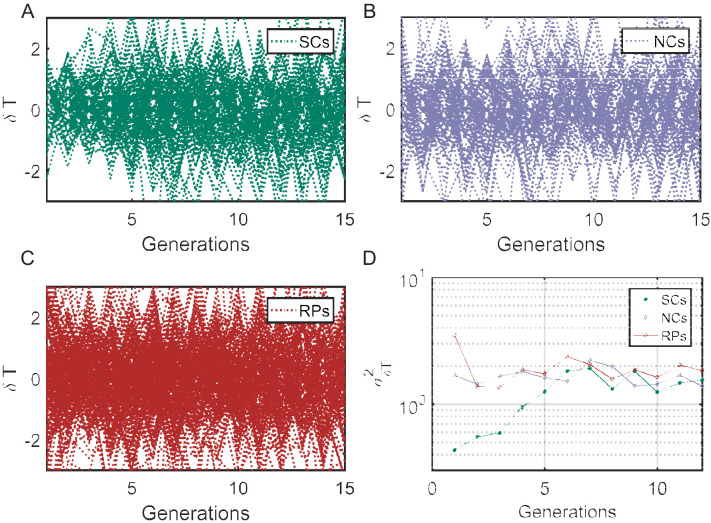
Figure 5—figure supplement 1. Cell-cycle time variance (σδT2) as a function of time.

Figure 5—figure supplement 1.

(A–C) Individual traces showing difference in cell-cycle times (δT) for SCs, NCs, and RPs, respectively. The variance (σ2) of cell cycles times differences (δT) as a function of time (D) represent the variance of the plots in (A–C) calculated at different time points using σδT2=<(δT)2><δT>2. σδT2 for SCs starts from a small value in first generation and saturate to a constant value after ∼7 generations (similar to the time scale obtained from the PCF ∼8 generations), while σδT2 for NCs and RPs remain constant over time.

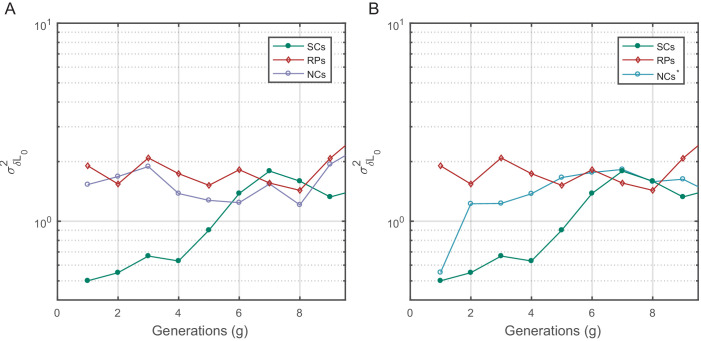
Figure 5—figure supplement 2. Cell size variance (σδL02) as a function of time.

Figure 5—figure supplement 2.

Birth size variance σδL02 was calculated similar to σδT2 in Figure 5—figure supplement 1. σδL02 for SCs increases slowly and saturates at a fixed value after ∼7 generations (mean lifetime ∼3.5 generations) similar to the time scale observed in the PCF. For NCs with random initial sizes (A), σδL02 remains constant similar to RPs. σδL02 for NCs with similar birth sizes starts from a value similar to SCs but shoots up to the saturation value within one generation.

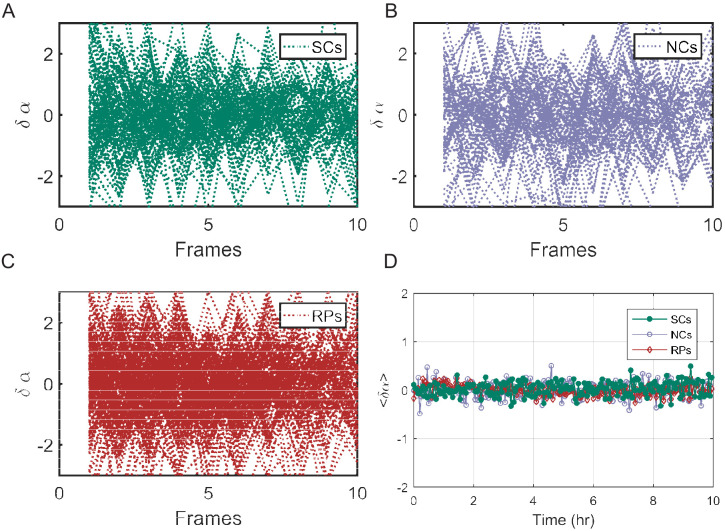
Figure 5—figure supplement 3. Exponential elongation rate difference (δα) as a function of time.

Figure 5—figure supplement 3.

Individual traces showing the difference between the exponential elongation rates (δα) for SCs (A), NCs (B), and RPs (C). (D) The mean of δα for all cell pairs remains zero along time as expected. For details of δα calculations, please refer to the main text.

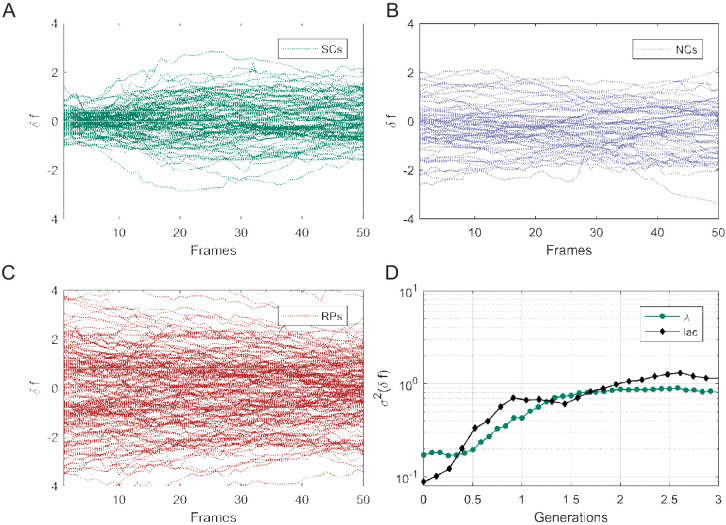
Figure 5—figure supplement 4. Mean fluorescence variance (σδf2) as a function of time.

Figure 5—figure supplement 4.

Individual traces showing the difference in mean fluorescence intensity (δf) of gfp expressed in SCs (A), NCs (B), and RPs (C). (D) The variance (σδf2 calculated similarly to σδT2 in Figure 5—figure supplement 1) of GFP expressed under the control of the Lac Operon promoter in lactose medium (metabolically relevant) is compared with that of GFP expressed under the control of the λ Pr promoter in LB medium (metabolically irrelevant). It is clear that both exhibit no significant difference and a very short memory (≤2 generations).