. 2021 Feb 8;10:e63646. doi: 10.7554/eLife.63646

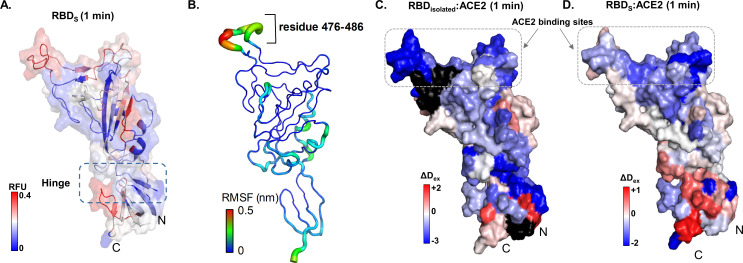
Figure 3. Map of receptor binding domain (RBD)isolated:angiotensin-converting enzyme 2 (ACE2) interactions.

(A) Relative fractional deuterium uptake values at t = 1 min for RBD (314–547) of spike (S) protein (RBDS) mapped onto the structure of RBD extracted from S protein model (see Supplementary file 1: Table S2). High and low exchanging regions are represented as shown in key, and regions with no coverage are shown in black. (B) The root mean square fluctuation (RMSF) values of backbone atoms on the RBD showing residues with high RMSF (476–486) as per key. Differences in deuterium exchanged between RBDisolated:ACE2 complex and free RBDisolated (C) and RBDS:ACE with free RBDS (D) at 1 min of deuterium labeling are mapped onto the structure of RBD. Protection from deuterium uptake and increases in exchange are indicated in blue and red, respectively. Regions with no peptide coverage are in black. RFU: relative fractional deuterium uptake.

Figure 3.

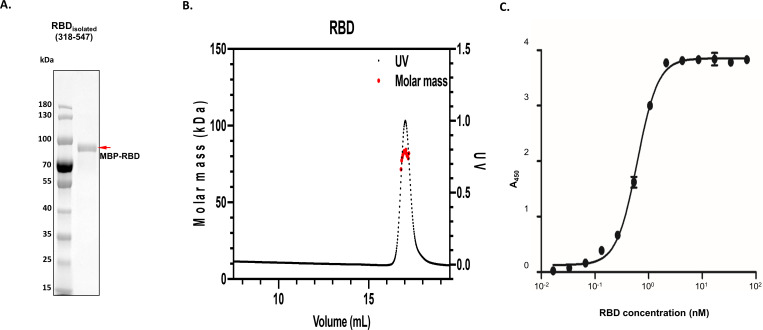
Figure 3—figure supplement 1. Homogeneity of receptor binding domain (RBD) isolated sample and validation of angiotensin-converting enzyme 2 (ACE2):RBD complex formation.

Figure 3—figure supplement 1.

(A) Images of denaturing polyacrylamide gel electrophoresis of purified RBD isolated (maltose-binding protein [MBP]-tagged) are shown along with its molecular sizes highlighted with red arrow, alongside protein standards. (B) Molecular weight analysis of expressed MBP-tagged RBD by size exclusion chromatography – multiple angle light scattering. The measured molecular weight (kDa) is 81.2 (±4.8%) for RBD. (C) Interactions between ACE2 and RBD represented by the binding curves obtained from enzyme-linked immunosorbent assay experiments as described in 'Materials and methods'. Testing of RBD was performed by adding 100 µL of 10.4 nM ACE2 to a maxisorp plate coated with RBD at varying concentrations.
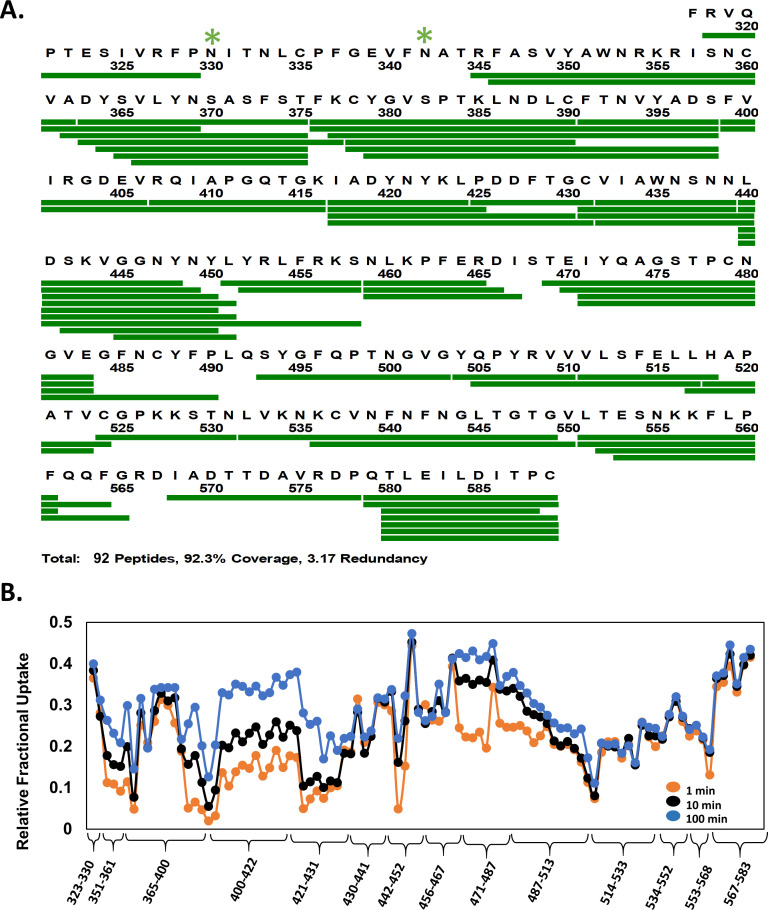
Figure 3—figure supplement 2. Primary sequence coverage and deuterium exchange profile of receptor binding domain (RBD)isolated.

Figure 3—figure supplement 2.

(A) Coverage map showing 92 peptides (green bar) spanning ~92% sequence of maltose-binding protein (MBP)-RBDisolated (318–589) fusion protein. Peptides spanning the N-terminal MBP affinity tag are not shown. Glycosylation sites are indicated by green asterisks. (B) Relative fractional deuterium uptake (RFU) plot of pepsin proteolyzed peptides of RBDisolated listed N- to C-terminus for deuterium labeling times as per key. Peptides are grouped into clusters for ease of display. RFU values for peptide clusters are tabulated in Figure 3—figure supplement 2—source data 1.
Figure 3—figure supplement 2—source data 1. Relative fractional deuterium uptake values at different labeling times for pepsin digest fragments of receptor binding domain (RBD)isolated.