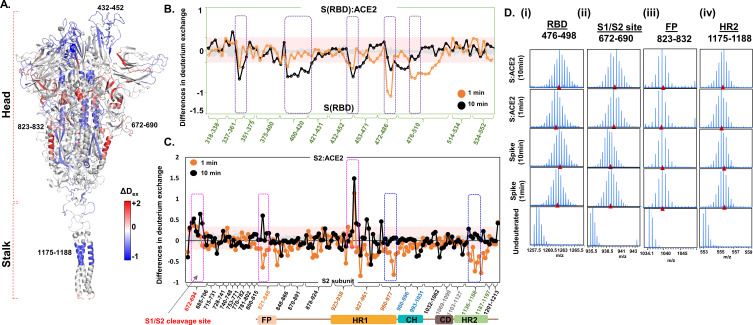
Figure 4. Angiotensin-converting enzyme 2 (ACE2) interaction induces large-scale allosteric changes across spike (S) protein.
(A) Differences in deuterium exchange (ΔDex) (t = 1 min) in S protein upon binding ACE2 showing decreased (blue) and increased (red) deuterium exchange, mapped onto the structure of S protein. Deuterium exchange differences (X-axis) for peptides from (B) receptor binding domain (RBD)S and S2 subunit (C). Peptides are grouped into clusters indicated by brackets (X-axis) for ease of display. Individual peptides within each cluster are identifiable from the source data (Figure 4—source data 1). Difference cutoff ±0.3 D (Houde et al., 2011) is the deuterium exchange significance threshold indicated by pink shaded box with standard error values in gray. Positive differences (>0.3 D) denote increased deuterium exchange, and negative differences (<−0.3 D) denote decreased deuterium exchange in S protein bound to ACE2. (B) Peptides spanning residues interacting with ACE2 are in purple. (C) Peptides spanning S1/S2 cleavage site, fusion peptide (FP) and heptad repeat 1 (HR1) are highlighted in pink boxes, while peptides spanning central helix and heptad repeat 2 (HR2) are in blue. (D) Stacked mass spectra with isotopic envelopes after deuterium exchange (t = 1, 10 min) for select peptides from (i) RBD (residues 476–498), (ii) S1/S2 cleavage site (residues 672–690), (iii) FP (residues 823–832), and (iv) HR2 (residues 1175–1188) are shown for the S protein and S:ACE2 complex. Mass spectra of the equivalent undeuterated peptide are shown for reference. The centroid masses are indicated by red arrowheads.

