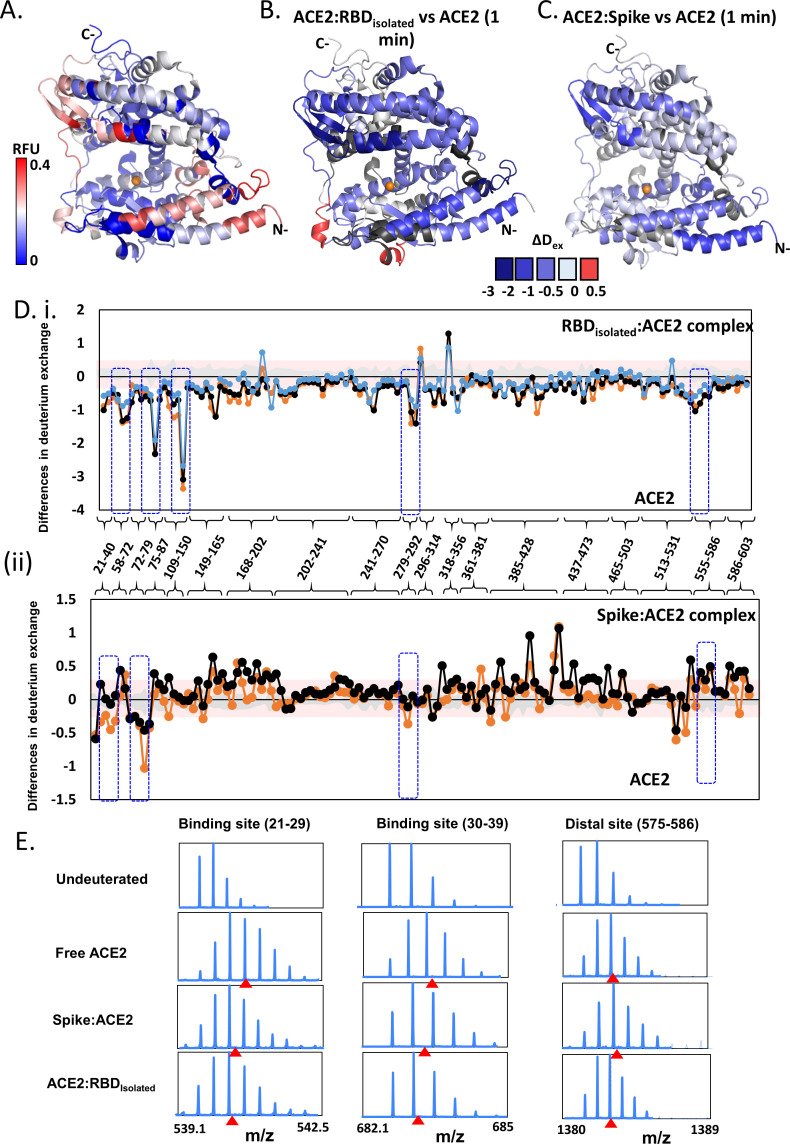
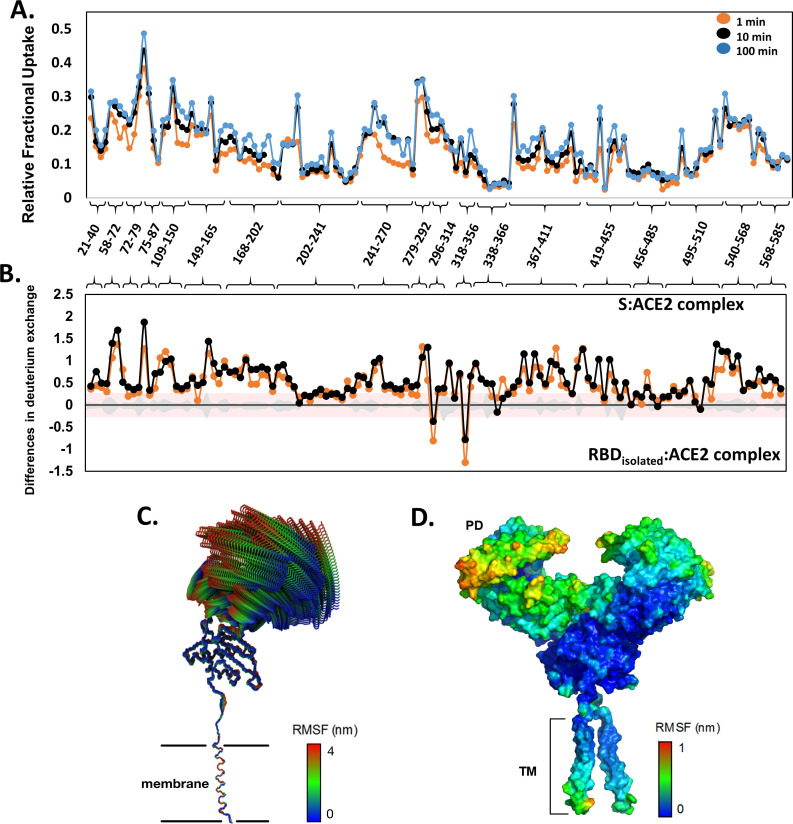
Figure 5. Effect of receptor binding domain (RBD)isolated and RBDS complexes on angiotensin-converting enzyme 2 (ACE2) dynamics.
(A) Structure of extracellular domain of ACE2 receptor (PDB ID: 1R42) depicting the relative fractional deuterium uptake (RFU) at t = 1 min. (B) Differences in deuterium exchange of RBDisolated:ACE2 complex and free ACE2 at t = 1 min mapped onto the structure of ACE2, predominantly showing decreased deuterium exchange in ACE2 (shades of blue). (C) Heat map of differences in deuterium exchange (t = 1 min) of S:ACE2 complex and free ACE2. (D) Plot showing differences in deuterium exchange between ACE2 and complexes with RBDisolated (i) and S (ii) at different labeling times. Peptides are grouped into clusters for ease of display and listed in source data (Figure 5—source data 1). Cutoff ± 0.3 D is the deuterium exchange significance threshold, indicated by pink shaded box, and standard errors are in gray. Positive differences denote increased deuterium exchange in (i) RBDisolated:ACE2 or (ii) S:ACE2 compared to free ACE2, while negative differences denote decreased deuterium exchange. Peptides spanning the sites of interaction with RBD and two distal sites (278–292, 574–585) are highlighted. (E) Stacked mass spectra showing isotopic distribution for select peptides spanning the binding sites (Ali and Vijayan, 2020; Chan et al., 2020; Wang et al., 2020a; Watanabe et al., 2020; Cai et al., 2020; Wang et al., 2020b; Li et al., 2005; Towler et al., 2004; Hamuro et al., 2008; Hoofnagle et al., 2003; Houde et al., 2011; Šali and Blundell, 1993; Hakansson-McReynolds et al., 2006; Dev et al., 2016; Eramian et al., 2006; Ramachandran et al., 1963; Petit et al., 2007; van Meer, 1998; Krijnse-Locker et al., 1994) and a distal allosteric site (575–586) for ACE2, S:ACE2, and RBDisolated:ACE2 are shown at 1 min deuterium labeling time. Centroids indicated by red arrowheads.


