. 2021 Feb 8;10:e63646. doi: 10.7554/eLife.63646

Figure 5. Effect of receptor binding domain (RBD)isolated and RBDS complexes on angiotensin-converting enzyme 2 (ACE2) dynamics.

(A) Structure of extracellular domain of ACE2 receptor (PDB ID: 1R42) depicting the relative fractional deuterium uptake (RFU) at t = 1 min. (B) Differences in deuterium exchange of RBDisolated:ACE2 complex and free ACE2 at t = 1 min mapped onto the structure of ACE2, predominantly showing decreased deuterium exchange in ACE2 (shades of blue). (C) Heat map of differences in deuterium exchange (t = 1 min) of S:ACE2 complex and free ACE2. (D) Plot showing differences in deuterium exchange between ACE2 and complexes with RBDisolated (i) and S (ii) at different labeling times. Peptides are grouped into clusters for ease of display and listed in source data (Figure 5—source data 1). Cutoff ± 0.3 D is the deuterium exchange significance threshold, indicated by pink shaded box, and standard errors are in gray. Positive differences denote increased deuterium exchange in (i) RBDisolated:ACE2 or (ii) S:ACE2 compared to free ACE2, while negative differences denote decreased deuterium exchange. Peptides spanning the sites of interaction with RBD and two distal sites (278–292, 574–585) are highlighted. (E) Stacked mass spectra showing isotopic distribution for select peptides spanning the binding sites (Ali and Vijayan, 2020; Chan et al., 2020; Wang et al., 2020a; Watanabe et al., 2020; Cai et al., 2020; Wang et al., 2020b; Li et al., 2005; Towler et al., 2004; Hamuro et al., 2008; Hoofnagle et al., 2003; Houde et al., 2011; Šali and Blundell, 1993; Hakansson-McReynolds et al., 2006; Dev et al., 2016; Eramian et al., 2006; Ramachandran et al., 1963; Petit et al., 2007; van Meer, 1998; Krijnse-Locker et al., 1994) and a distal allosteric site (575–586) for ACE2, S:ACE2, and RBDisolated:ACE2 are shown at 1 min deuterium labeling time. Centroids indicated by red arrowheads.

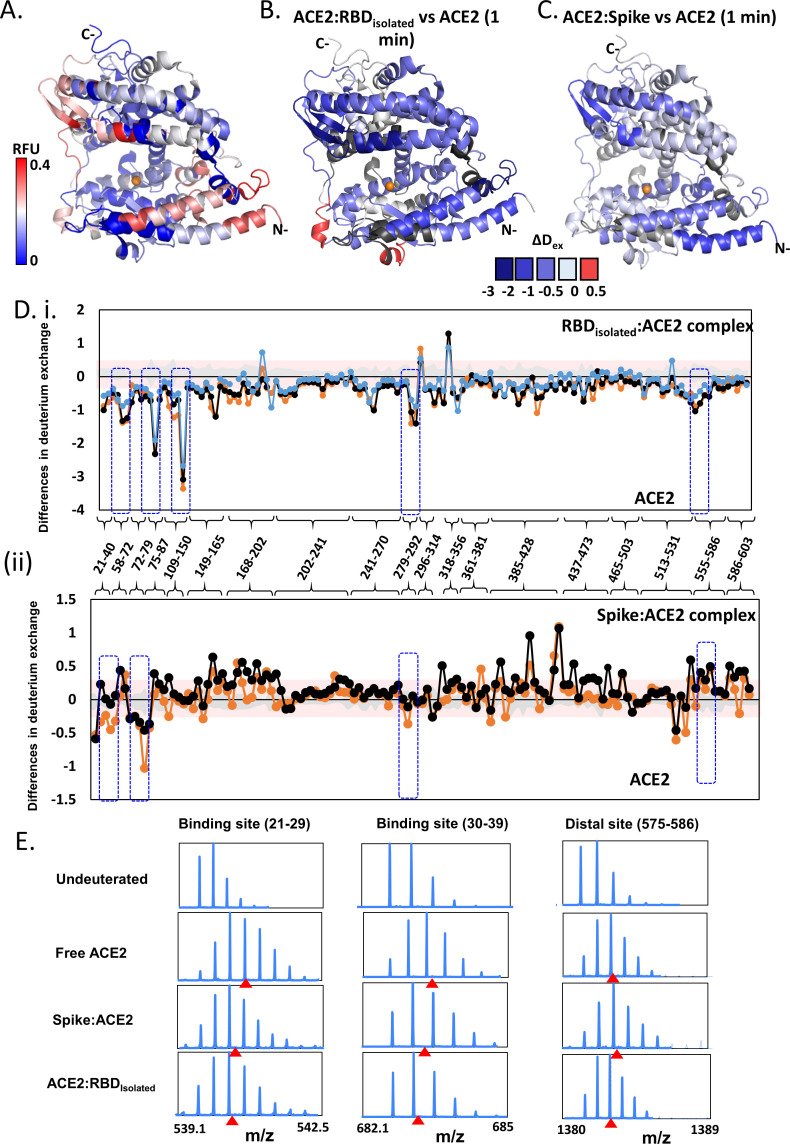
Figure 5—source data 1. Differences in deuterium exchange between receptor binding domain (RBD)isolated:angiotensin-converting enzyme 2 (ACE2) and spike (S):ACE2 complexes with free ACE2 at indicated labeling times.

Figure 5.

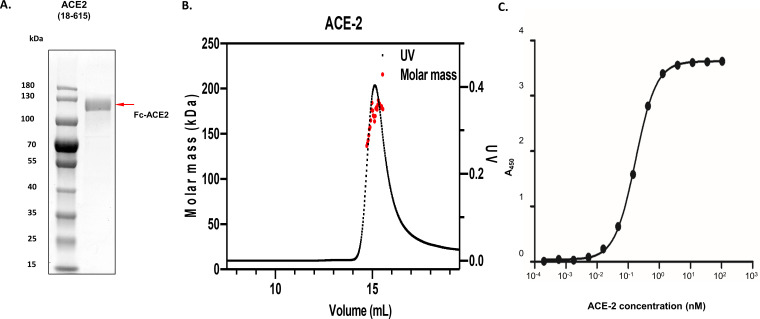
Figure 5—figure supplement 1. Homogeneity of angiotensin-converting enzyme 2 (ACE2) protein samples and validation of ACE2:receptor binding domain (RBD) complex formation.

Figure 5—figure supplement 1.

(A) Images of denaturing polyacrylamide gel electrophoresis of purified ACE2 (Fc-tagged) is shown, and its molecular sizes are highlighted with red arrow, alongside protein standards. (B) Molecular weight analysis of Fc-tagged ACE2 by size exclusion chromatography – multiple angle light scattering. The measured molecular weight (kDa) is 193.6 (±7.9%) for ACE2. (C) Interactions between ACE2 and RBD represented by the binding curves obtained from enzyme-linked immunosorbent assay experiments as described in 'Materials and methods'. Testing of ACE2 was performed by adding ACE2 at varying concentrations to a maxisorp plate coated with 100 µL of 27.2 nM RBD.
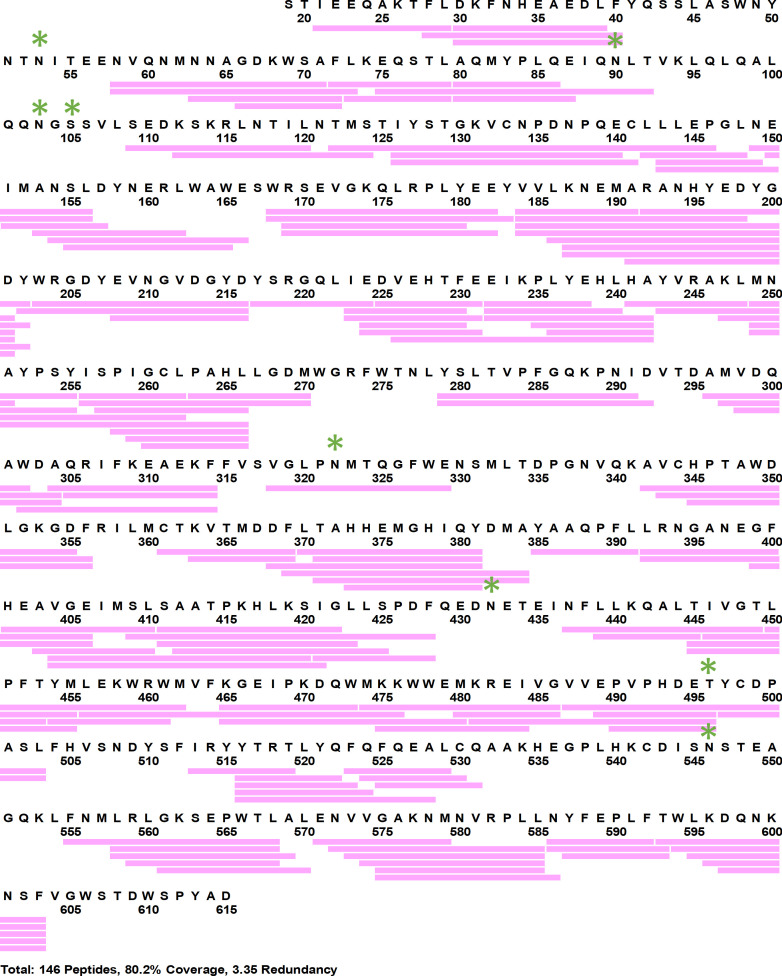
Figure 5—figure supplement 2. Pepsin digest map and sequence coverage of angiotensin-converting enzyme 2 (ACE2).

Figure 5—figure supplement 2.

(A) Coverage map showing 146 peptides (pink horizontal bars) covering ~80% sequence of ACE2 (18–615). Sequence of Fc-tag is not shown. Glycosylation sites are represented by green asterisks.
Figure 5—figure supplement 2—source data 1. Relative fractional deuterium uptake values for pepsin digest fragments of angiotensin-converting enzyme 2 (ACE2) at indicated labeling times.
Figure 5—figure supplement 2—source data 2. Differences in deuterium exchange between spike (S):angiotensin-converting enzyme 2 (ACE2) complex minus receptor binding domain (RBD)isolated:ACE2 complex for peptides of ACE2 at indicated labeling times.
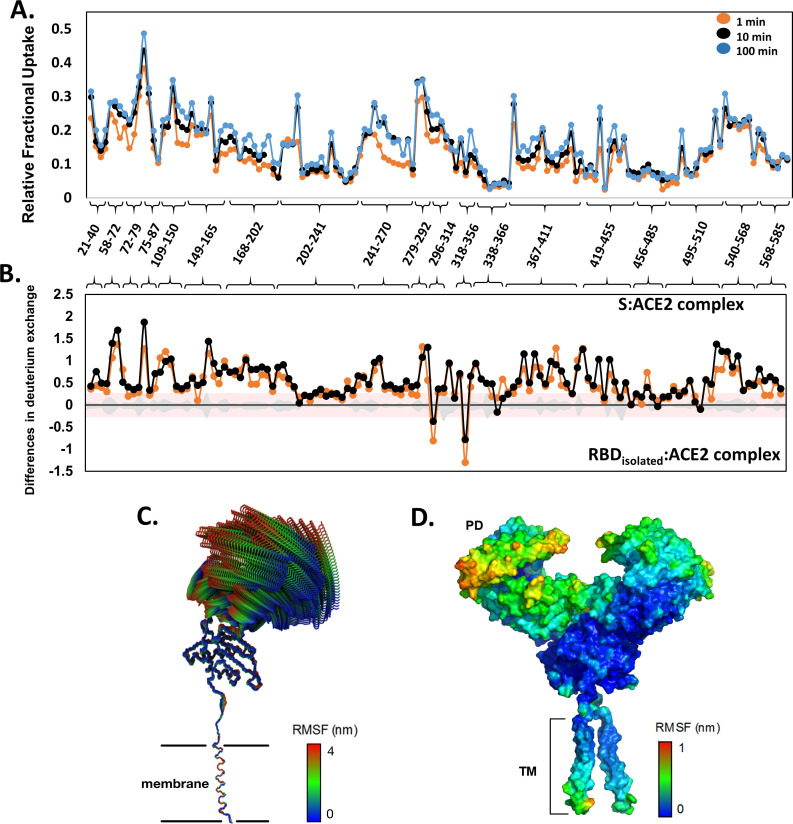
Figure 5—figure supplement 3. Deuterium uptake profile for angiotensin-converting enzyme 2 (ACE2) receptor and all-atom molecular dynamics (MD) simulation of the ACE2-B0AT1 complex.

Figure 5—figure supplement 3.

(A) Relative fractional deuterium uptake values of pepsin proteolyzed peptides listed in N- to C-terminus of ACE2 (peptides 18–615) for deuterium labeling times. Peptides are grouped into clusters for ease of display and are listed in source data (Figure 5—figure supplement 2—source data 1). (B) Differences in deuterium exchange (Y-axis) for ACE2 peptides listed from N- to C-terminus (X-axis) between S:ACE2 complex and receptor binding domain (RBD)isolated:ACE2 complex. Deuterium exchange significance threshold of ±0.3 D is indicated in red and standard errors in gray (within ±0.3 D) and are tabulated in source data (Figure 5—figure supplement 2—source data 2). (C) The first principal motion of all backbone atoms of the ACE2 monomer as determined by principal component analysis. (D) The root mean square fluctuation (RMSF) values of the ACE2 receptor mapped onto the surface of the ACE2. TM: transmembrane domain.