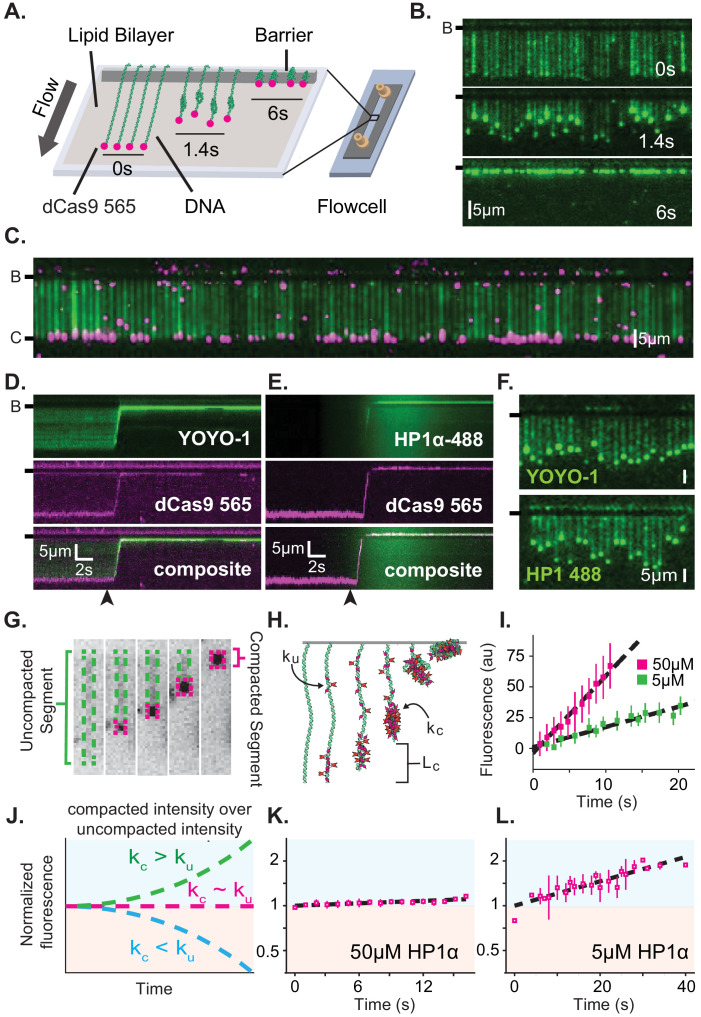
Figure 1. Characterization of DNA compaction by HP1α.
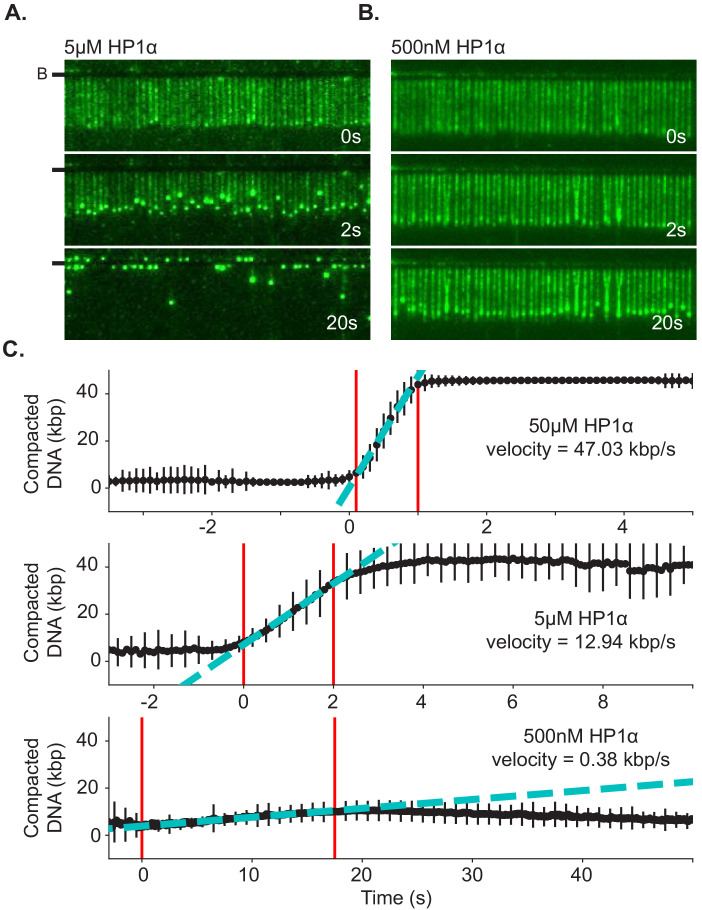
(A) Cartoon of the DNA curtains assay showing compaction of DNA. (B) Timestamped images of DNA labeled with YOYO-1 undergoing compaction by 50 μM HP1α (unlabeled) shown before, during, and after compaction. (B-) or (-) specifies location of the barrier. (C) DNA curtain end-labeled with fluorescent dCas9 (C-). The dCas9 is targeted to a site 750 bp from the untethered end of the DNA. (D and E) Kymograms of DNA compaction by 50 μM HP1α. (D) DNA labeled with YOYO-1 (top), dCas9-565 (middle), and composite image (bottom). (E) HP1α−488 (top), DNA labeled with dCas9-565 (middle), and composite image (bottom). Arrowheads represent estimated time of protein injection. (F) Still images during DNA compaction of either DNA labeled with YOYO-1 (top) or HP1α−488 (bottom). (G) A DNA molecule undergoing compaction by HP1α specifying the uncompacted segment (green) and compacted segment (magenta). (H) Cartoon of HP1α compacting DNA over time. Lc is the length of compacted DNA, ku is the rate of fluorescence increase for the uncompacted DNA segment, and kc is the rate fluorescence increase for the compacted DNA segment. See Materials and methods for more information. (I) Fluorescence increase of HP1α−488 on uncompacted DNA. N = 25 for both concentrations, error bars represent standard deviations. (J) Cartoon showing potential results from normalizing the fluorescence of the compacted segment by that of the uncompacted segment. (K and L) Measured normalized compacted HP1α fluorescence relative to uncompacted HP1α. N = 25 for both concentrations, error bars represent standard deviations.


