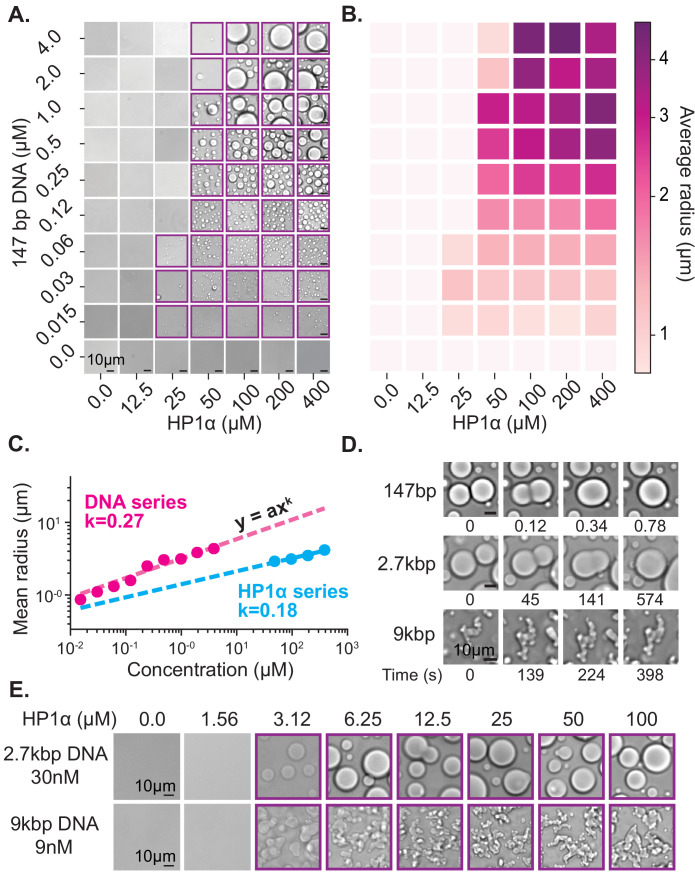
Figure 2. Characterization of HP1α-DNA condensate formation.
(A) Bright-field images of mixtures of HP1α and 147 bp DNA. (B) Heat map of the average radius of condensates for each condition in (A). (C) Average condensate radius for 1 μM 147 bp DNA plotted against HP1α concentration (cyan) or 100 μM HP1α plotted against 147 bp DNA concentration (magenta) and fit to a power law, error bars (obscured) represent the SEM. (D) Time stamped brightfield images of 100 μM HP1α and 147 bp, 2.7 kbp, or 9 kbp DNA depicting fusion and coalescence behavior. (E) Brightfield images of HP1α with either 30 nM 2.7 kb DNA (top) or 9 nM 9 kbp DNA (bottom). Throughout, purple boxes indicate presence of condensates.


