. 2021 Mar 4;10:e64563. doi: 10.7554/eLife.64563

Figure 3. Distinct characteristics of HP1α and DNA in condensates.

(A) FRAP of HP1α in condensates. Timestamped images from FRAP experiments for fluorescent HP1α and four lengths of linear DNA (147 bp, 2.7 kbp, 9 kbp, or 50 kbp). Scale bar indicates 5 μm. (B) Recovery of HP1α fluorescence intensity and (C) half-life of HP1α recovery plotted for each DNA length tested. N = 15 for each condition, error bars represent standard deviations. (D) Two-color HP1α mixing experiments. Condensates formed separately with 2.7 kbp unlabeled DNA and either HP1α−488 (green) or HP1α−565 (magenta) imaged 1.16 min after mixing. (E) Two-color DNA mixing experiments. Condensates formed separately with unlabeled HP1α and 2.7 kbp DNA-488 (green) or 2.7 kbp DNA-565 (magenta) imaged 4.4 min after mixing. (F) MNase treatment of condensates. Mixed condensates formed separately with unlabeled HP1α and 9 kbp DNA-488 (green) or 9 kbp DNA-565 (magenta) treated with either 1 mM CaCl2 or 1 mM CaCl2 and 20U MNase. Images shown for both conditions before and 76 s after the treatment.

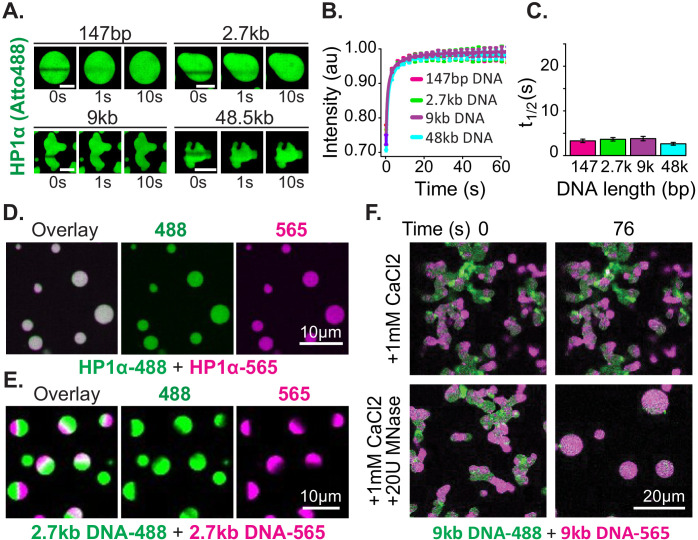
Figure 3.

Figure 3—figure supplement 1. Whole droplet FRAP of HP1α−488 in HP1α-DNA condensates.

Figure 3—figure supplement 1.

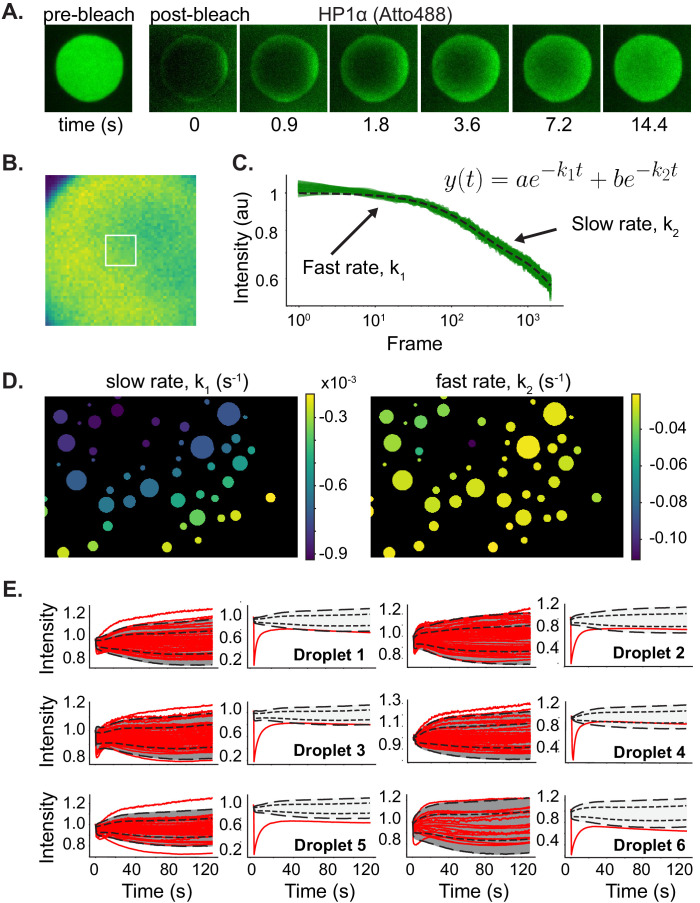
(A) Timestamped images of whole droplet HP1α−488 FRAP. (B and C) Time dependence of HP1α−488 fluorescence decay within (B) a sample condensate region (white box) under normal imaging conditions, (C) fit to a bi-exponential function. (D) Sample images colored by average decay rates. (E) Time dependence of fluorescent signal from unbleached condensates within the field of view (left) versus the photobleached condensate (right) for six FRAP experiments. Dotted lines indicate 1 and 2 standard deviations from the mean determined from the unbleached condensates.
Figure 3—figure supplement 2. FRAP of DNA and mixing of HP1α and DNA in condensates.

Figure 3—figure supplement 2.

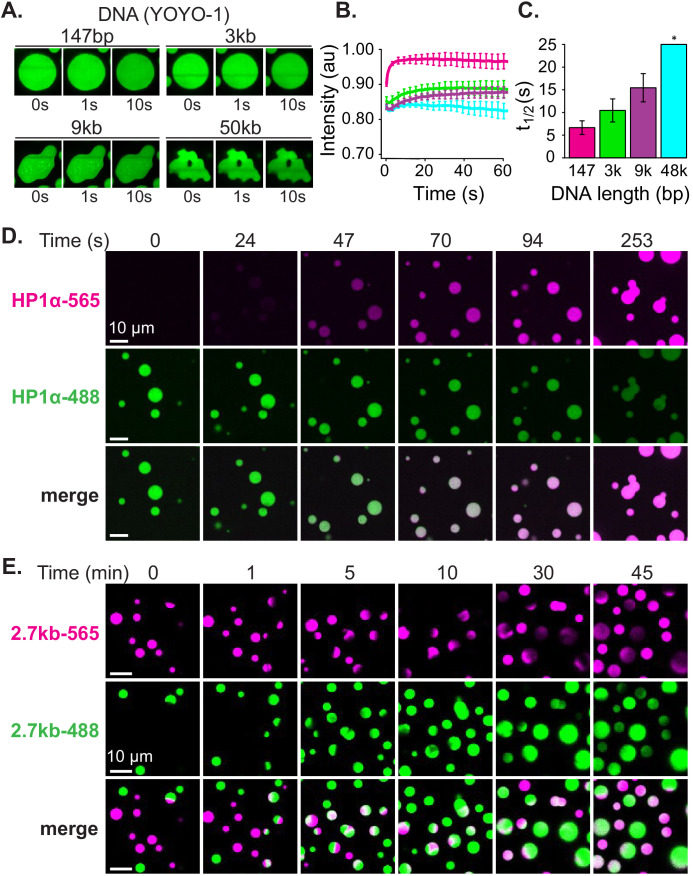
(A) FRAP of YOYO-1 in condensates. Timestamped images from FRAP experiments for four lengths of linear DNA (147 bp, 2.7 kbp, 9 kbp, or 50 kbp). (B) Recovery of YOYO-1 fluorescence intensity and (C) half-life of recovery plotted for each DNA length tested. (*) indicates half-life not determined. N = 15 for each condition, error bars represent standard deviations. (D) Timestamped images of two-color HP1α-DNA condensate mixing experiments. Condensates formed separately with 2.7 kbp unlabeled DNA and either HP1α−488 (green) or HP1α−565 (magenta). (E) Timestamped images of two-color HP1α-DNA condensate mixing experiments. Condensates formed separately with HP1α and 2.7 kbp DNA-488 (green) or 2.7 kbp DNA-565 (magenta).