. 2021 Mar 4;10:e64563. doi: 10.7554/eLife.64563

Figure 4. HP1α-DNA condensates resist disruptive forces and retain memory of past strain.

(A) Cartoon of optical trap experiments. (B) Confocal images of relaxed, intermediate, and extended states of DNA (unlabeled) in the presence of HP1α (magenta). Black arrowheads indicate trapped beads and white arrowheads indicate HP1α-DNA condensates. (C) Force extension curves for DNA in the absence (black line) or presence of HP1α (colored lines). Each trace represents a single stretch-relax cycle (SRC) of the same DNA strand. Traces are colored by pulling order from first extension (violet) to the final extension (red). * indicates rupture event. (D) Histogram of DNA extension at 20 pN in the absence (black) or presence of HP1α (magenta). N = 150, 10 DNA strands pulled fifteen individual times each. (E and F) Force change for DNA incubated with HP1α in (E) relaxed or (F) extended conformation. Shown is the average of the first (magenta) and second (cyan) SRC. Data are averaged over 17 DNA strands, gray shaded region represents SEM.

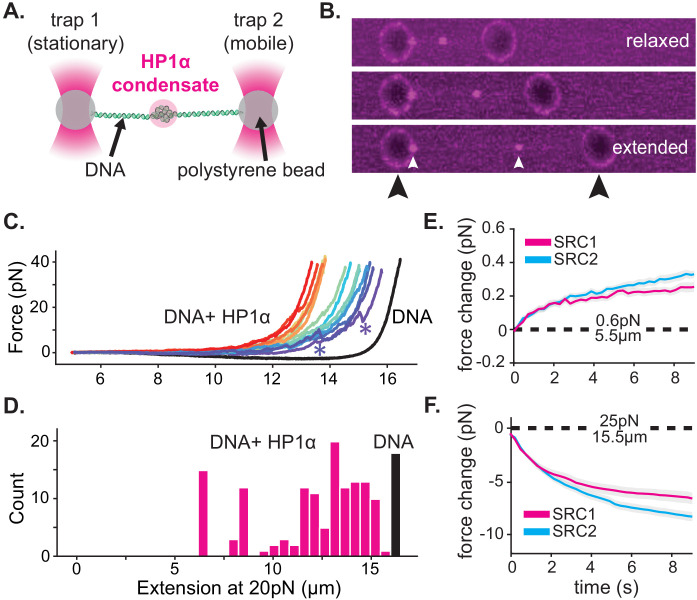
Figure 4.

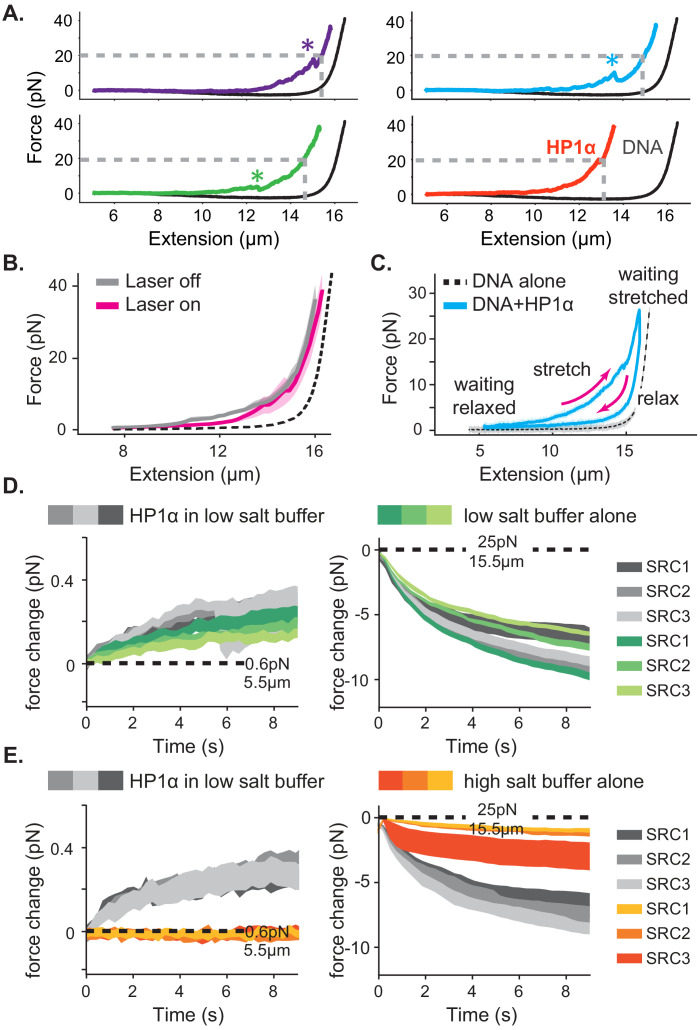
Figure 4—figure supplement 1. Representative traces and controls for optical trap experiments.

Figure 4—figure supplement 1.

(A) Four representative traces from Figure 4C. All traces are separate pulls from the same DNA strand. * indicates rupture event. Gray dashed line indicates the DNA extension at 20pN force reported in Figure 4D. (B) Average force extension curves for the second SRC either with (magenta) or without (gray) laser illumination. The force extension curve of DNA alone is shown in black. (C) Force extension curve across a stretch-relax cycle including waiting periods in the extended or relaxed configurations. (D and E) Force change in the relaxed (left) and stretched (right) configurations in the presence (gray) and absence (green or orange) of HP1α. SRCs in the absence of protein performed in either (D) low salt (70 mM KCl, green) or (E) high-salt (500 mM KCl, orange) buffer. Data are averaged over 17 DNA strands, filled colored regions represent SEM.