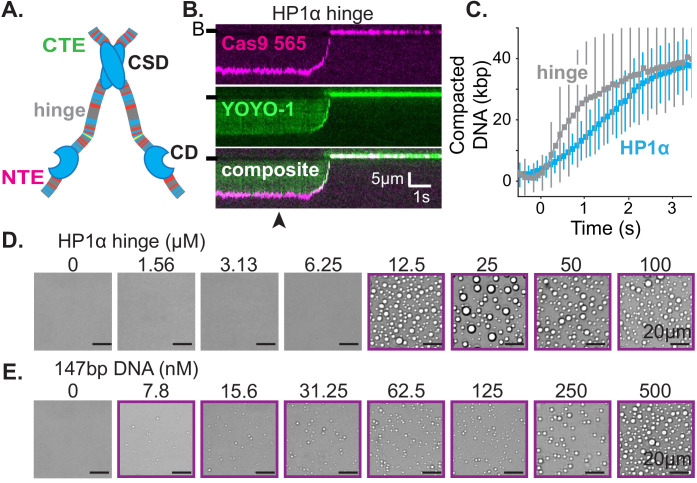
Figure 5. The hinge region of HP1α is sufficient for DNA compaction and condensate formation.
(A) Cartoon of HP1α with color-coded disordered regions: positive residues (K and R) blue, negative residues (E and D) red, proline yellow, and all other residues gray. Key HP1α domains are labeled: chromodomain (CD), chromoshadow domain (CSD), hinge, N-terminal extension (NTE), and C-terminal extension (CTE). (B) Kymogram of DNA compaction by the hinge domain. DNA is labeled with dCas9 (top) and YOYO-1 (middle), also shown as composite image (bottom). Arrowhead represent estimated time of protein injection. (B-) or (-) specifies location of the barrier. (C) Average DNA compaction by 5 μM HP1α (N = 157) and 5 μM HP1α-hinge (N = 169), error bars represent standard deviations. (D and E) Bright-field images of the HP1α-hinge and DNA. (D) Titration of the HP1α-hinge with 500 nM 147 bp DNA. (E) Titration of 147 bp DNA with 12.5 μM HP1α-hinge. Purple boxes indicate presence of condensates.


