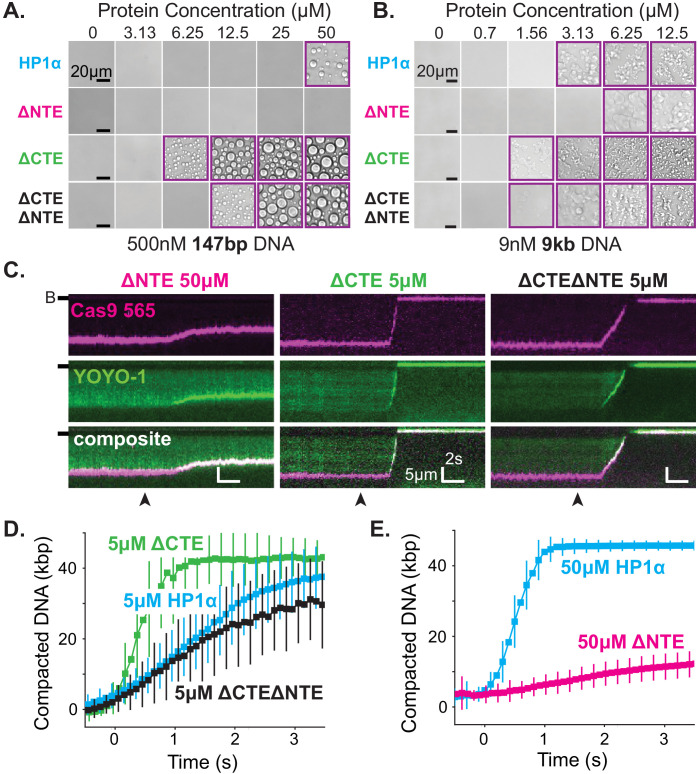
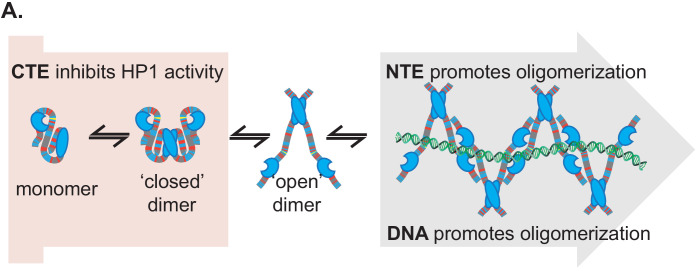
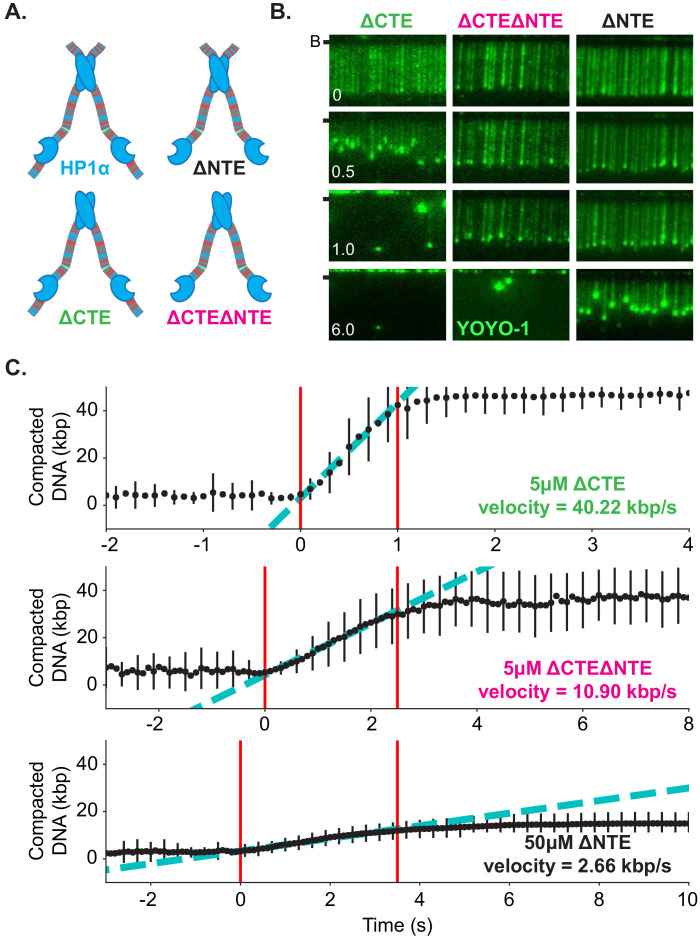
Figure 6. The disordered extensions of HP1α regulate DNA compaction and condensate formation.
(A and B) Bright-field images of HP1α domain mutants and DNA. (A) Titration of HP1α domain mutants with 500 nM 147 bp DNA. (B) Titration of HP1α domain mutants with 9 nM 9 kbp DNA. Purple boxes indicate presence of condensates. (C) Kymograms of DNA compaction by HP1α domain mutants. DNA is labeled with dCas9 (top) and YOYO-1 (middle), also shown as composite image (bottom). Data shown for reactions including 50 μM HP1αΔNTE, 5 μM HP1αΔCTE, and 5 μM HP1αΔNTEΔCTE, respectively. Arrowheads represent estimated time of protein injection. (B-) or (-) specifies location of the barrier. (D) Average DNA compaction by 5 μM HP1α (N = 157), 5 μM HP1αΔCTE (N = 96), and 5 μM HP1αΔCTEΔNTE (N = 89). (E) Average DNA compaction by 50 μM HP1α (N = 272) and 50 μM HP1αΔNTE (N = 163). In (D) and (E) error bars represent standard deviations.


