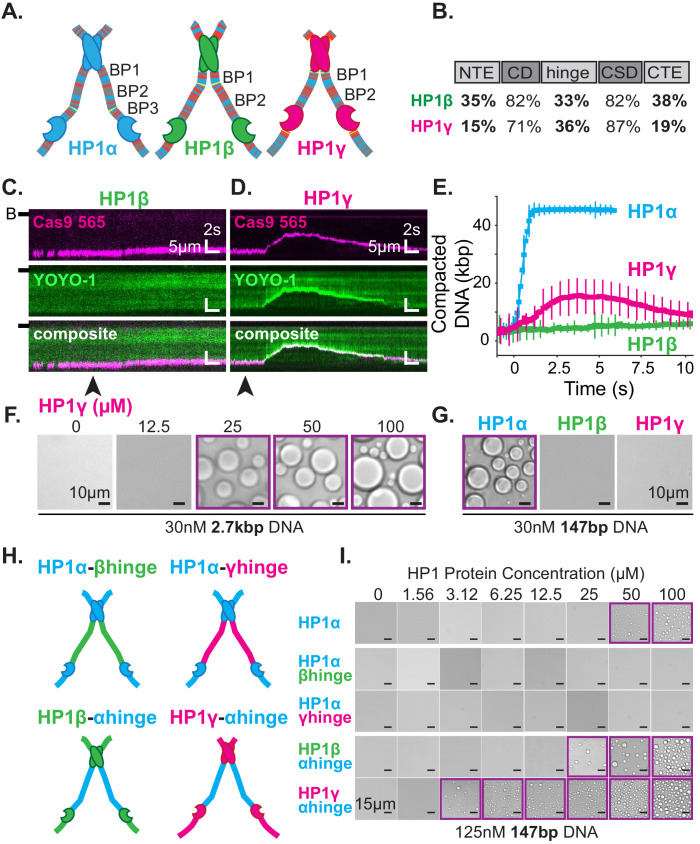
Figure 7. DNA compaction and condensate formation activity of HP1β and HP1γ.
(A) Cartoons of the three paralogs of human HP1 with color-coded disordered residues: positive residues (K and R) blue, negative residues (E and D) red, proline yellow, and all other residues gray. Basic patches (BP) for each paralog are labeled. (B) Comparison of amino acid homology between HP1α and HP1β or HP1γ. (C and D) Kymograms of DNA compaction by (C) HP1β and (D) HP1γ. DNA is labeled with dCas9 (top) and YOYO-1 (middle), also shown as composite image (bottom). Arrowheads represent estimated time of protein injection. (B-) or (-) specifies location of the barrier. (E) Average DNA compaction by 50 μM HP1α (N = 272), HP1β (N = 86), and HP1γ (N = 54). Error bars represent standard deviations. (F) Bright-field images of HP1γ and 2.7 kbp DNA. (G) Bright-field images of 100 μM HP1α, HP1β, or HP1γ and 147 bp DNA. (H) Cartoon of HP1 hinge domain swaps. (I) Bright-field images of HP1 domain swap mutants and 147 bp DNA. Purple boxes indicate presence of condensates.


