. 2021 Feb 9;10:e62865. doi: 10.7554/eLife.62865

Figure 5. Hourglass-shaped conservation of OCRs in mouse limb development.

(A) ATAC-seq signals in the enhancer regions of the HoxA cluster. e1 to e4, known limb enhancers. Green vertical lines below the signals, peak regions determined by MACS2. (B) Comparison of a quality index, FRiP, for ATAC-seq data. Blue bars are samples with a FRiP score >0.2. The number in the end of the label name indicates the replicate number. (C) Conservation analysis of sequences in ATAC-seq peaks with BLASTN. The values to the right of each graph indicate the fraction of conserved sequences in the total peak regions. The common name of each genome sequence is indicated above the graph. The not-conserved heatmap indicates the fraction of sequences that were not aligned to any genome sequences and thus serve as a negative control. (D) Temporal changes of sequence conservation frequency in ATAC-seq peaks with LAST. Error bars: SEM.

Figure 5.

Figure 5—figure supplement 1. ATAC-seq quality control.

Figure 5—figure supplement 1.

(A) Correlation distance between samples. The numbers in the end of the sample names indicate the replicates of indicated stages. Darker color means more similar gene expressions. (B) Percentage of peak regions in the genome sequence. (C) ATAC-seq signals in BPM (blue signals), peak regions (blue rectangles) and the known limb enhancers of HoxA cluster (red rectangles, e1–e19). Note that only e5 is not covered by ATAC-seq data.
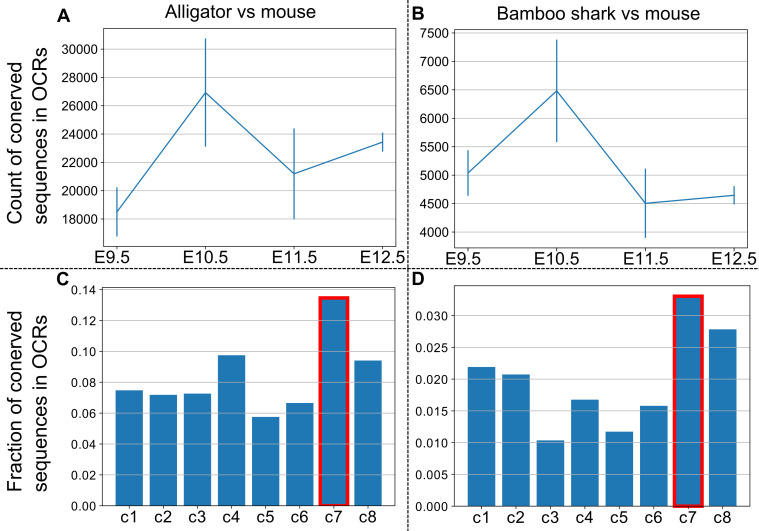
Figure 5—figure supplement 2. Conservation measures of OCRs.

Figure 5—figure supplement 2.

(A, B) The absolute count of OCRs that overlap with sequences conserved between the mouse and the alligator (A) and the bamboo shark (B). Error bars, SEM. (C, D) The fraction of conserved OCRs sorted by the identified clusters in Figure 6A. Sequence conservation was estimated by pairwise alignment using LAST (A–D).