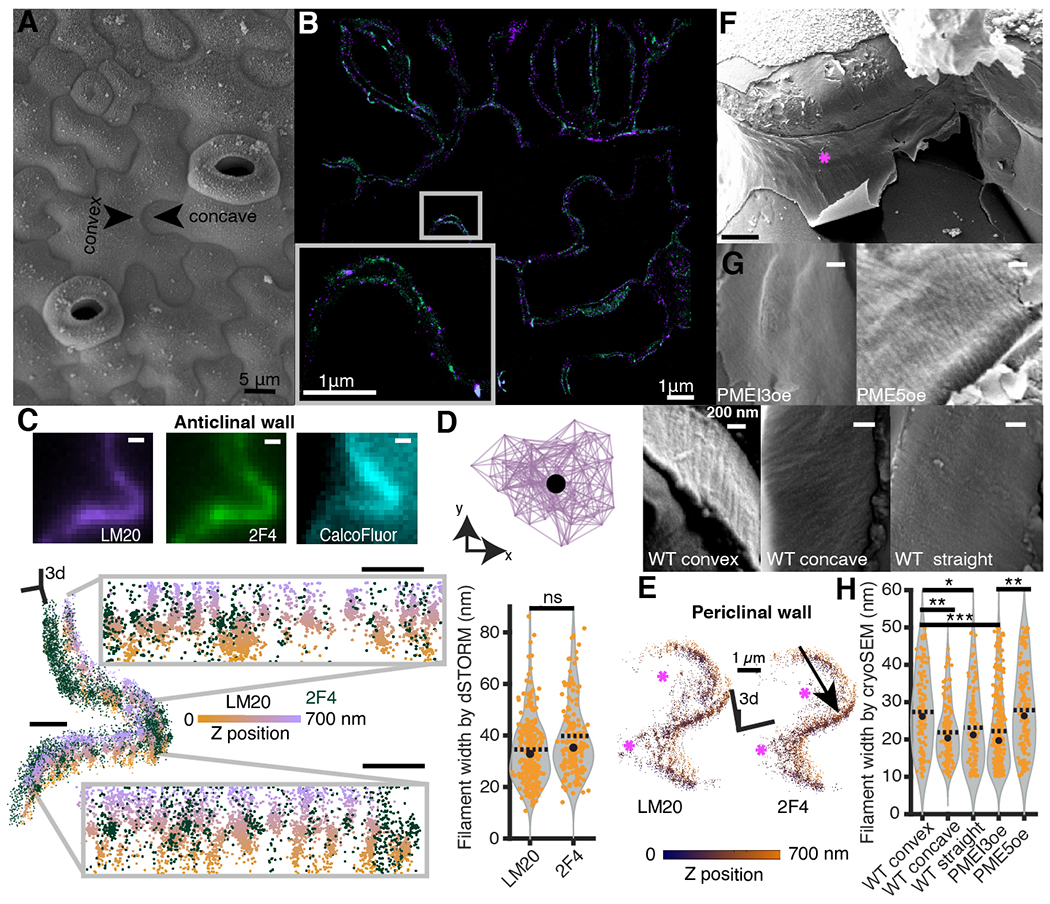
Fig. 1. The 3D-dSTORM nanoscopy and cryoSEM reveals homogalacturonan nanofilaments.

(A) A surface view of cotyledon epidermal pavement cells using cryoSEM. (B) A high magnification epidermal region observed by dSTORM; methylated (violet) and demethylated (green) HG. Pixel size, 10 nm. (C) Diffraction-limited image of the lobed region of the anticlinal wall (top), and the same region imaged with 3D-dSTORM shown as a 3D scatterplot of the coordinates of localized emitters (bottom); demethylated (green) and methylated (orange-violet colormap encoding the Z-position) HG nanofilaments. Grey insets represent two wall segments in the orthogonal view. Scale bars, 500 nm. (D) Lateral view of segmented nanofilament represented as a bidirectional graph (top); the filament width is estimated as the median pairwise distance between centroid (black dot) and each point in the graph. The nanofilament width (bottom) representing respectively 159 and 96 methylated and demethylated filaments. (E) The 3D-dSTORM imaging of lobed wall segment showing junction between the anticlinal wall (black arrow) and periclinal walls (magenta stars). The orange-blue colormap encodes Z-position. (F) Representative gross-scale cryoSEM picture with the fracture exposing convex anticlinal wall (magenta star). Pixel size, 20 nm. (G) Fine-scale pictures of the convex anticlinal walls in PMEI3oe and PME5oe (top row) and WT convex, concave and straight anticlinal walls (bottom row). Pixel size, 4 nm. (H) The filament width distribution observed by CryoSEM, representing 109, 137 and 104 filaments measured in respectively WT convex, concave and straight walls. For PME5oe and PMEI3oe, the convex and concave wall data were pooled together; 139 and 322 filaments were measured in PME5oe and PMEI3oe. P-values: * - p < 0.05, ** - p < 0.001, *** - p < 0.0001, obtained with multiple group comparison Kruskal-Wallis test and Bonferroni correction. In (D) and (H), black dot and dashed line represent median and mean respectively.
