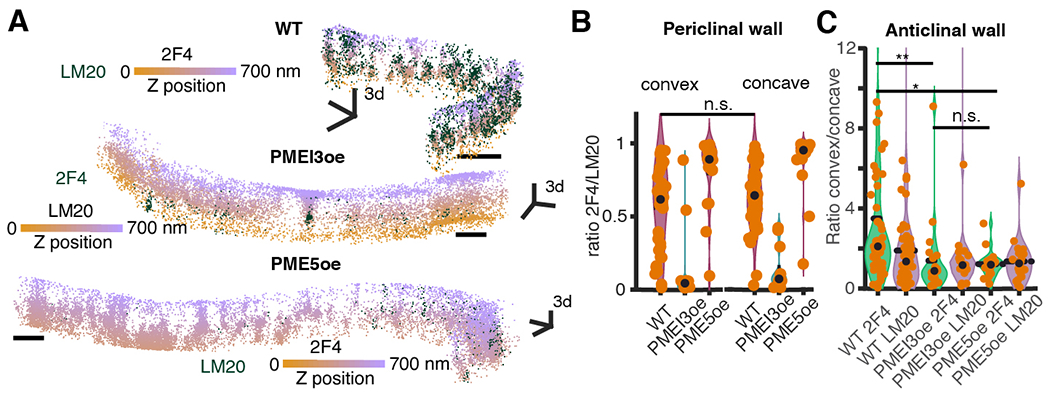
Fig. 2. HG methylation asymmetry affects lobe formation.

(A) Representative lobed wall segments imaged with 3D-dSTORM in WT, PME5oe and PMEI3oe cotyledons. The orange-violet colormap encodes Z-position. Scale bars, 500 nm. (B) HG methylation asymmetry between convex and concave regions of a lobe in the periclinal walls and (C) in the lobed anticlinal walls for WT, PME5oe and PMEI3oe and straight walls for WT plants. P-values: * - p < 0.05, ** - p < 0.001, *** - p < 0.0001, obtained with multiple group comparison Kruskal-Wallis test and Bonferroni correction. The number of analyzed regions: 100, 39, and 23 (B), 53, 22 and 25 (C) for WT, PME5oe, and PMEI3oe cotyledons respectively.
