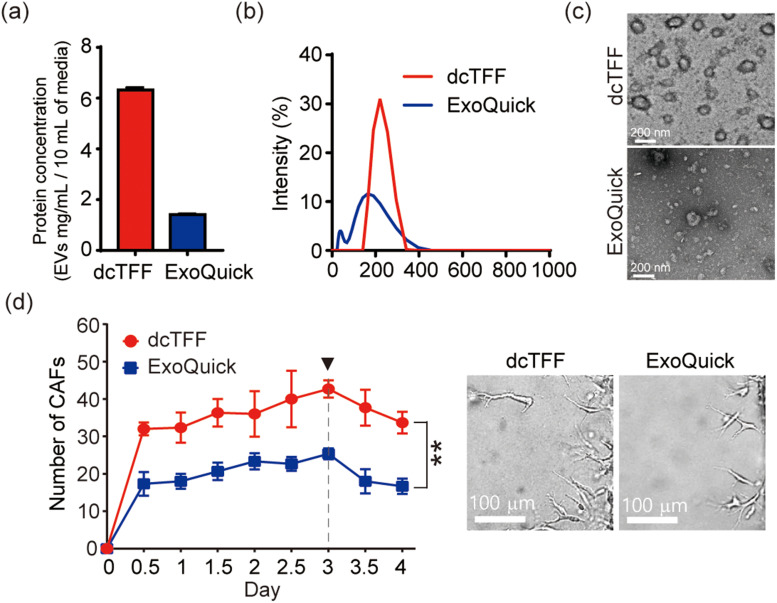
FIG. 6.
Comparison of cancer cell-derived EVs isolated by dcTFF and Exoquick. (a) Evaluation of protein concentration of EVs. (b) Size distribution and z-average of EVs. (c) TEM images of EVs. (d) Verification of EV activity that induces differentiation of cancer-associated fibroblasts (CAFs). Data are presented as means ± standard error of mean (SEM) (** p < 0.01).

