
Figure 2.
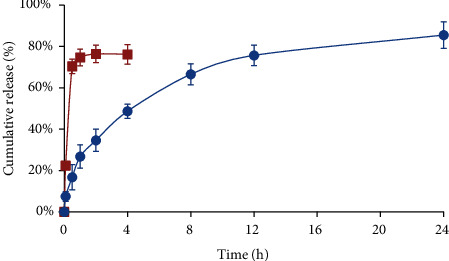
In vitro release profile of TP suspension (■) or MC-PLGA-TP-NP (●) in PBS (pH = 7.4) using the dialysis bag diffusion technique. The experiment was repeated in triplicate, and data were given as the mean ± standard deviation (n = 3).
Official websites use .gov
A
.gov website belongs to an official
government organization in the United States.
Secure .gov websites use HTTPS
A lock (
) or https:// means you've safely
connected to the .gov website. Share sensitive
information only on official, secure websites.
In vitro release profile of TP suspension (■) or MC-PLGA-TP-NP (●) in PBS (pH = 7.4) using the dialysis bag diffusion technique. The experiment was repeated in triplicate, and data were given as the mean ± standard deviation (n = 3).