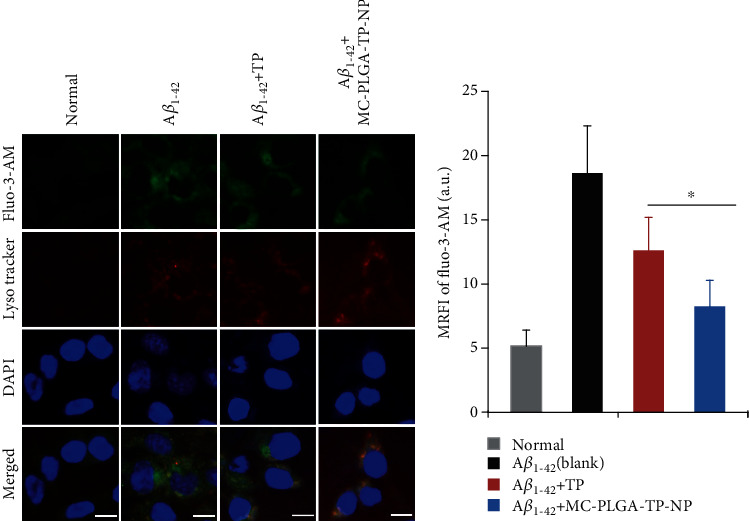
Figure 5.

Fluorescence observation of calcium influx in the differentiated PC12 cells stained by different molecular probes. (a) The fluorescence images of the differentiated PC12 cells induced by Aβ1-42 after the incubation with TP or MC-PLGA-TP-NP for 48 h. (b) Statistic data for the mean relative fluorescent intensity (MRFI) calculated by MetaMorph software. The experiment was repeated five times, and data were represented as the mean ± standard deviation (n = 5). The scale bar represented 20 μm. ∗Significant difference (p < 0.05, versus TP).
