Figure 1.

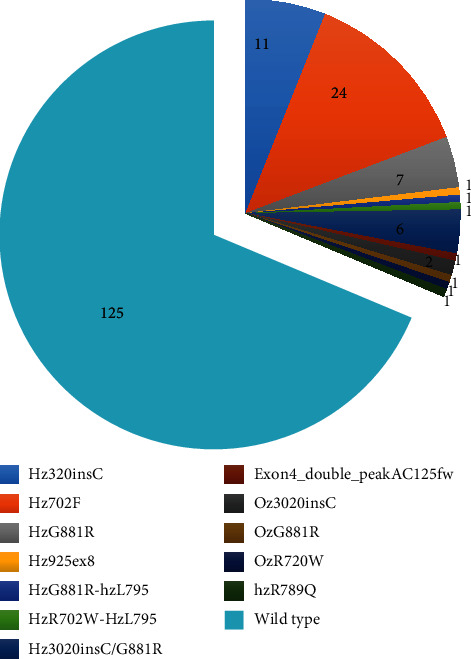
Genotype distribution of the clinical sample population. The figure shows the distribution of CARD15/NOD2 genotypes detected in the examined cohort of surgical patients (number of patients).

Genotype distribution of the clinical sample population. The figure shows the distribution of CARD15/NOD2 genotypes detected in the examined cohort of surgical patients (number of patients).