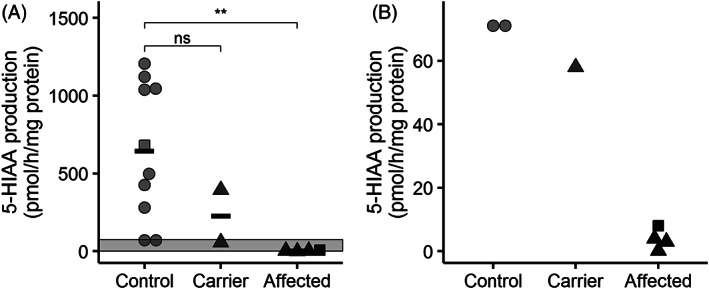
FIGURE 3.

5‐HIAA production as a measure of MAO‐A activity in controls (n = 9), carriers (n = 2) and affected patients (n = 3). Circles represent random controls, squares belong to family 1, and triangles belong to family 2. Panel A shows the full range, panel B zooms in on the indicated area in A. Horizontal bars represent group means. ns: not significant (P > .05), ** P <= .01 (as calculated by Wilcoxon signed‐rank test)
