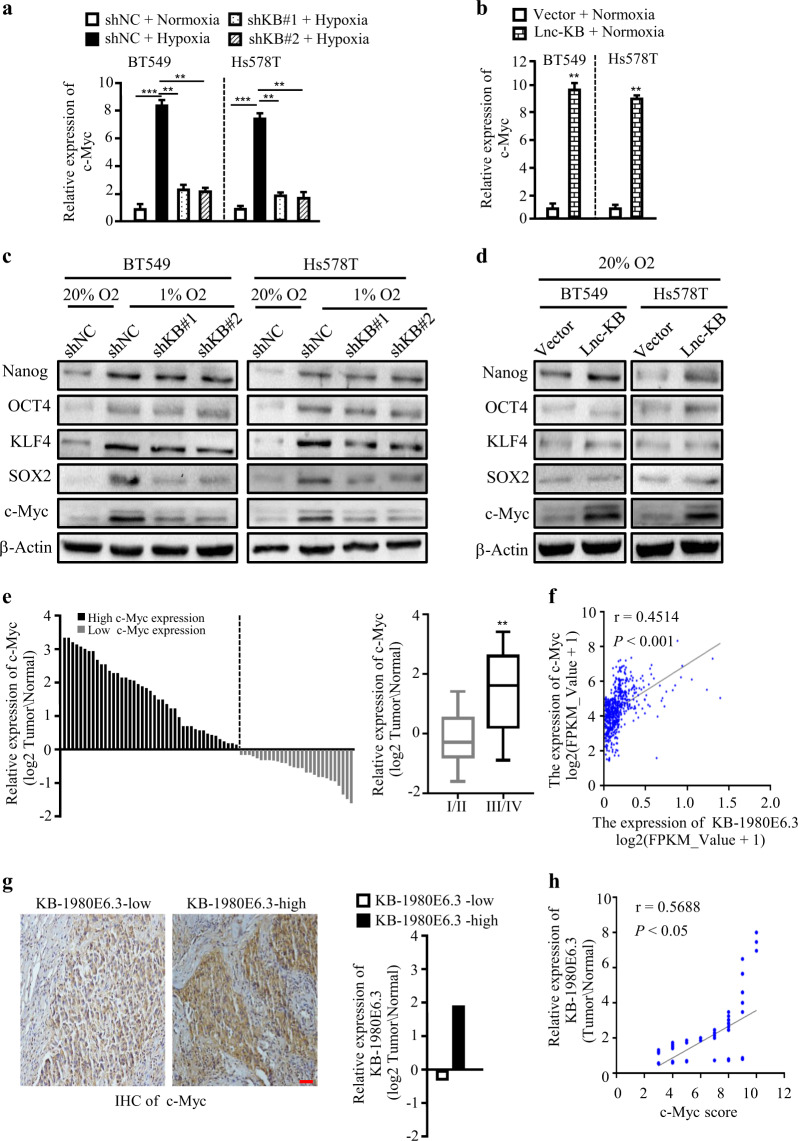
Fig. 4. LncRNA KB-1980E6.3 is positive correlated with c-Myc expression.
a, b c-Myc mRNA levels in lncRNA KB-1980E6.3 knockdown BT549 and Hs578T cells under hypoxia conditions (a) or lncRNA KB-1980E6.3 overexpressing BT549 and Hs578T cells under normoxia conditions (b). c, d The protein levels of c-Myc, KLF4, SOX2, OCT4, and Nanog in lncRNA KB-1980E6.3 knockdown BT549 and Hs578T cells under hypoxia conditions (c) or lncRNA KB-1980E6.3 overexpressing BT549 and Hs578T cells under normoxia conditions (d). e The heights of the columns in the chart represent the log2-transformed fold changes (tumor vs normal) in c-Myc expression in 71 paired breast cancer tissues and adjacent non-cancerous tissues (left panel). The relative log2-transformed fold changes (tumor vs normal) of c-Myc in 71 cases of breast tumors with different clinical stages were measured by qRT-PCR (right panel). f The correlation between c-Myc mRNA and lncRNA KB-1980E6.3 expression levels in breast cancer patients based on the data from TCGA database. g Representative IHC staining images showing c-Myc protein levels in lncRNA KB-1980E6.3 high or low tumor tissues (left panel). Scale bar, 50 μm. LncRNA KB-1980E6.3 levels in the lncRNA KB-1980E6.3 high or low tumor groups (right panel). h The correlation between lncRNA KB-1980E6.3 RNA level and c-Myc protein IHC scores. Data are shown as mean ± SD of three independent experiments (**P < 0.01; ***P < 0.001).

