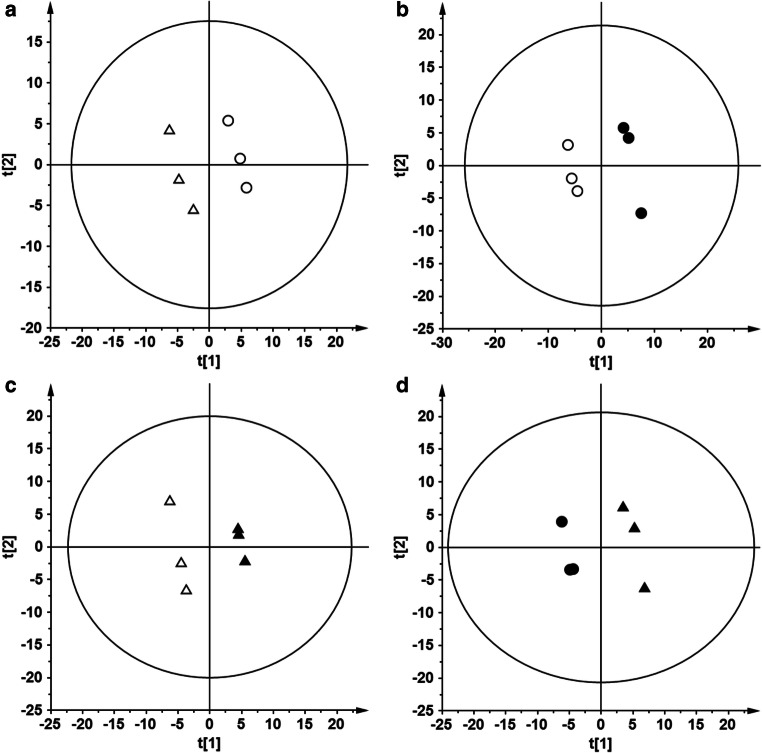
Fig. 2.
Partial least squares discriminant analysis plots showing discrimination between the studied hippocampal regions. Plots were obtained based on the RP(+) data, which were log-transformed and Par scaled. White circle, C_CA1; white up-pointing triangle, C_CA2–4,DG; black circle, IR_CA1; black up-pointing triangle, IR_CA2–4,DG. Panel a: C_CA1 vs. C_CA2–4,DG; R2 = 0.996, Q2 = 0.677. Panel b: C_CA1 vs. IR_CA1; R2 = 0.998, Q2 = 0.794. Panel c: C_CA2–4,DG vs. IR_CA2–4,DG; R2 = 1.000, Q2 = 0.890. Panel d: IR_CA1 vs. IR_CA2–4,DG; R2 = 0.996, Q2 = 0.765

