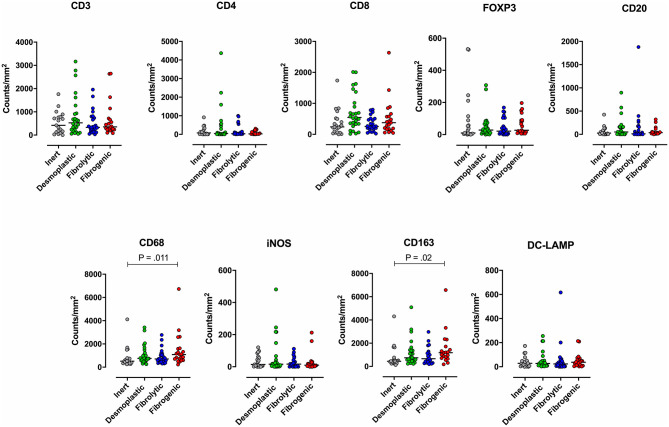
Figure 3.
Immune contexture across stromal subtypes. Scatterplots representing the distribution of leukocyte density (counts/mm2) in the stromal compartment of PDAC cases exhibiting distinct stromal subtypes (Inert, Desmoplastic, Fibrolytic, Fibrogenic). Each symbol denotes an individual patient. The bars denote median values for each group. Differences between groups were analyzed by Kruskal-Wallis tests followed by Dunn's post-hoc test. Multiplicity adjusted P-values are reported.

