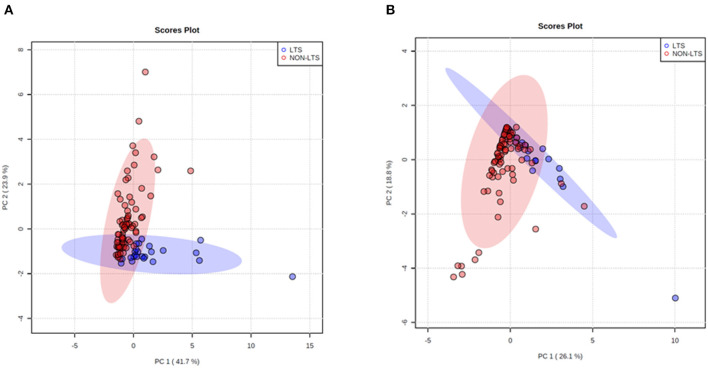
Figure 6.
Principal Component Analysis (PCA) demonstrates distinct immune landscape in LTS vs. NON-LTS samples. PCA performed using (A) stromal and (B) intratumoral immune cell densities show distinct clustering of LTS vs. NON-LTS patient groups. Each symbol denotes an individual patient and 95% confidence ellipses are drawn. The percent variation is explained by first principal component (PC1, x-axis) and the second principal component −2 (PC2, y-axis).

